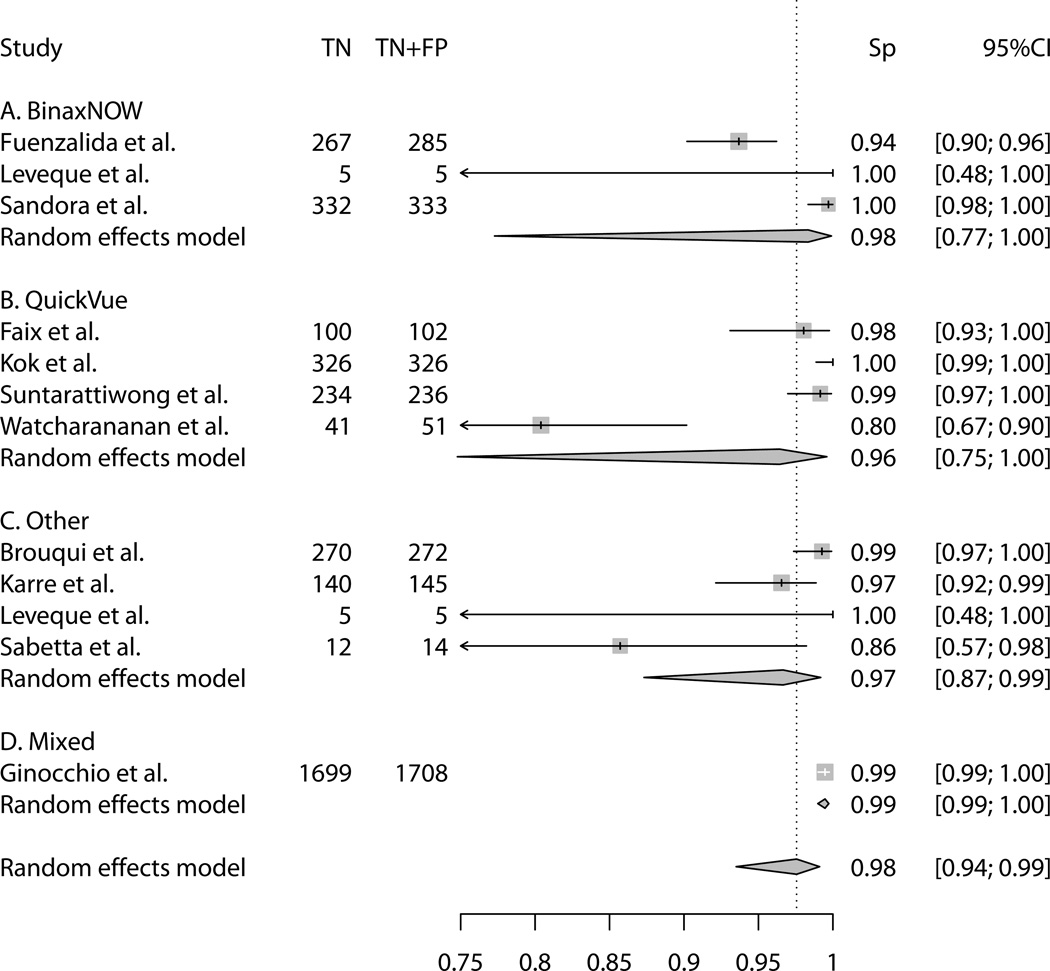
Figure 2.
Forest plot of specificity estimates and 95% confidence intervals (CI). Point estimates of sensitivity from each study are shown as solid squares. Solid lines represent the 95% CIs. Squares are proportional to weights based on the random effects model. The pooled estimate and 95% CI is denoted by the diamond at the bottom. Sp = specificity; TN = true negatives; FP = false positives;

