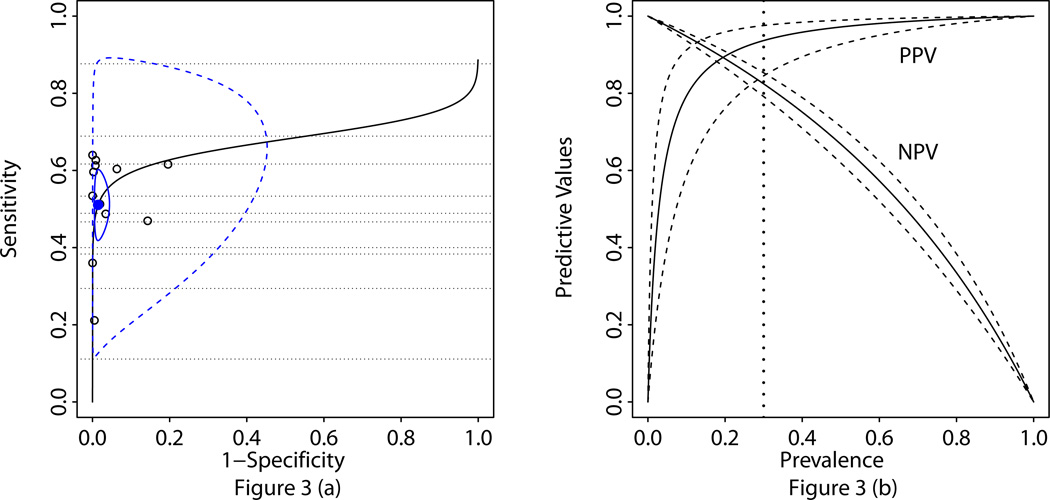
Figure 3.
The summary receiver operating characteristic plot (panel a) and the overall PPV and NPV plot (panel b) based on the bivariate random effects model. In panel a, each open circle represents a study in the meta-analysis with both sensitivity and specificity estimates of a rapid test; dashed lines represent those studies with only a sensitivity estimate of a rapid test; the solid circle represents the overall summary point; solid and dotted contour curves denote the boundaries of the 95% confidence region of the summary point and the 95% prediction region, respectively. In panel b, solid and dashed lines denote the estimate and 95% confidence interval; PPV = positive predictive value; NPV = negative predictive value.

