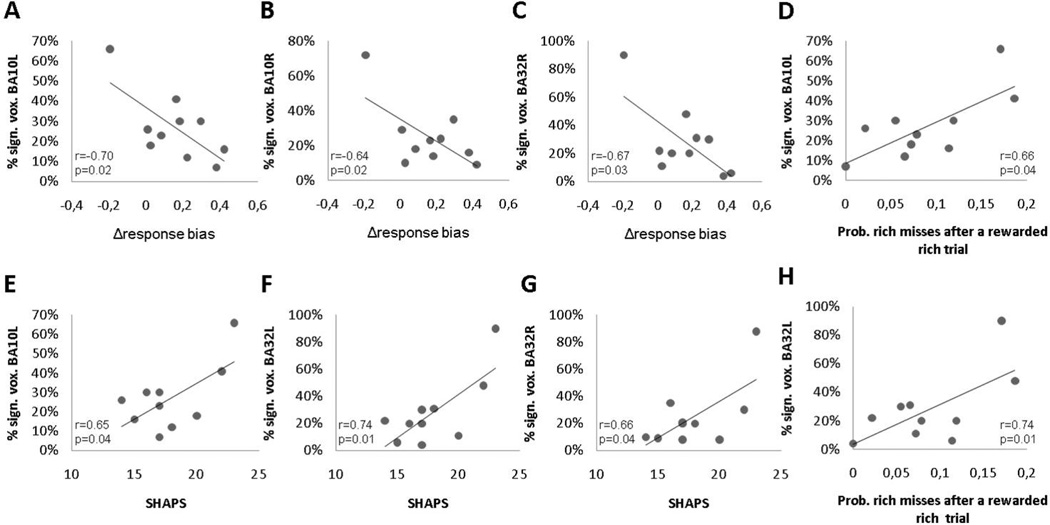
Figure 5.
Scatterplot and Pearson correlation between Δresponse bias and the percent of significant voxels in the (A) left vmPFC (BA10L), (B) right vmPFC (BA10R) and (C) left dACC (BA32L). Panel D and H show the relationship between the probability of a rich miss immediately after a rewarded rich trial and the percentage of statistically significant voxels in the left vmPFC (BA10L) and left dACC (BA32L), respectively. Panel E, F, and G show the relationship between SHAPS scores and the percentage of statistically significant voxels in the left vmPFC (BA10L), left dACC (BA32L), and right dACC (BA32R).

