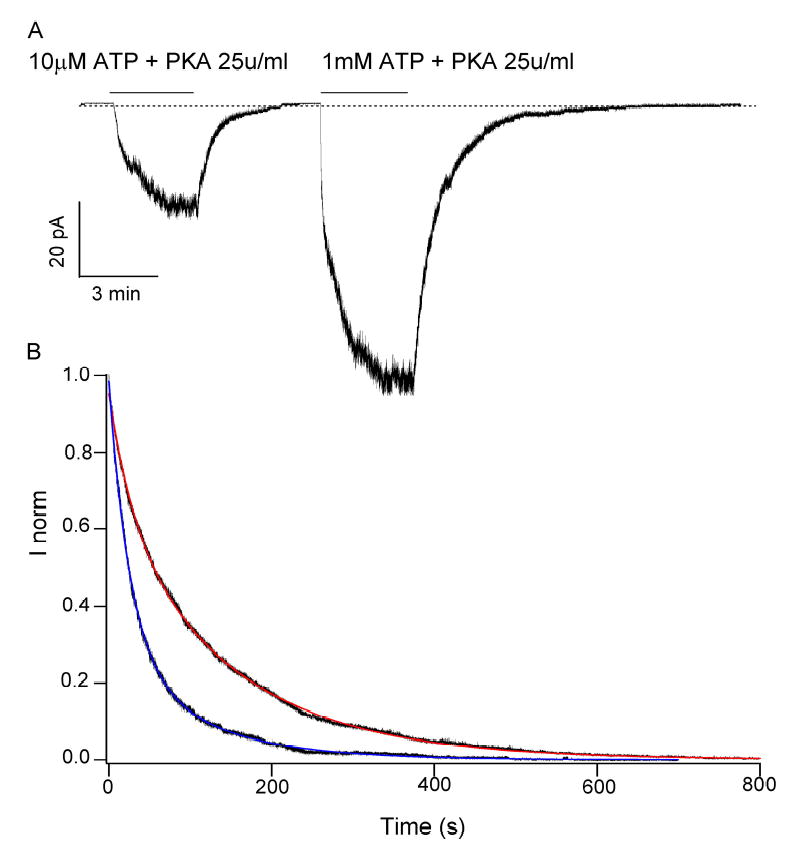
Figure 8.

Macroscopic current relaxation of E1371S-CFTR currents. (A) Sample trace of current relaxations for E1371S-CFTR channels activated with 10 μM ATP + PKA, or with 1 mM ATP + PKA. (B) Normalized ensemble current relaxations upon removal of 1 mM ATP (from 12 patches) or 10 μM ATP (from 9 patches). The 1 mM ATP relaxation curve can be fitted with a double exponential function (red curve) with time constants of 149.3 ± 0.02 s (69%) and 29.59 ± 0.02 s (31%). The 10 μM ATP curve can be fitted also with a double exponential function (blue curve) with time constants of 107.53 ± 0.08 s (29%), and 26.32 ± 0.01 s (71%).
