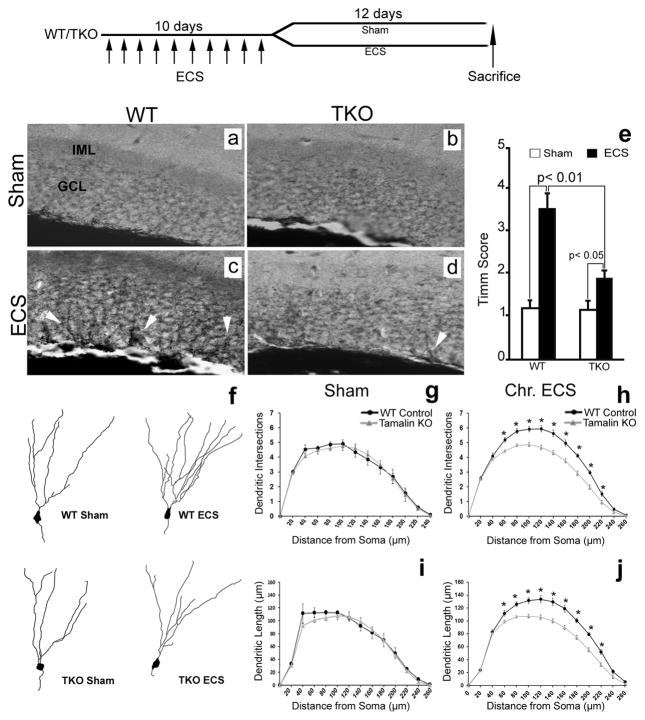
Figure 6. Chronic ECS-induced neuronal sprouting is blunted in tamalin KO mice.
Analysis of mossy fiber sprouting by Timm staining (a–e) and dendritic complexity of dentate granule cells by Golgi-cox staining (f–j). Representative Timm-stained hippocampal sections from sham (a, b) or chronic ECS-treated (c, d) WT (a, c) or TKO (b, d) mice. Note the reduced presence of Timm granules (white arrowheads in c,d) in the GCL of the hippocampus of ECS-treated TKO mice compared to ECS-treated control mice (n≥5 animals for each group). (e) Quantitative analysis of Timm scores. Data representing the Mean ± SEM was analyzed by nonparametric ANOVA followed by posthoc Dunn test. (f) Representative neurolucida reconstruction of DG Golgi-stained neurons from sham- or chronic ECS-treated WT and TKO mice. (g–j) Sholl analysis of dendritic intersection number and dendrite length of DG neurons showing no difference between sham-treated WT and tamalin KO mice (g–i; n=5 mice in each group; 15 neurons/mouse). Only EC-treated WT animals display a significant increase in the number of intersections (h) and dendritic length (j) compared to sham treated controls (n≥9 mice in each group; 15 neurons/mouse). * p < 0.05. Data represent the Mean ± SEM analyzed by two way ANOVA followed by Bonferroni posthoc test. Top: schematic indicating that Sham or Chronic ECS-treated (once a day for 10 consecutive days) animals were sacrificed 12 days after the last ECS.

