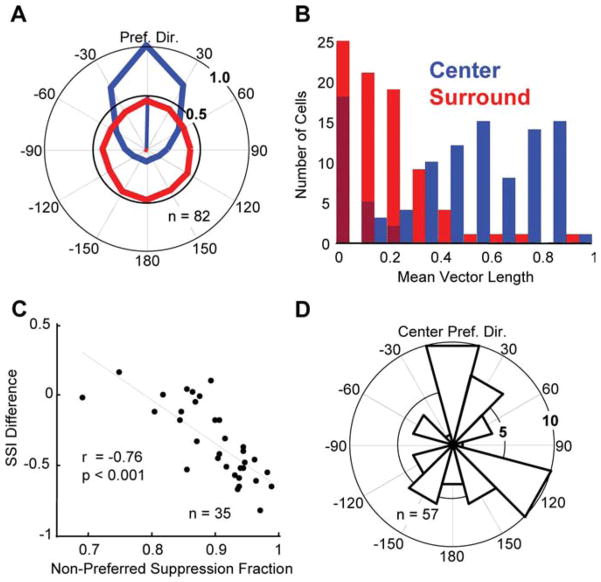
Figure 6.
Surround direction tuning: population data. A, Population mean center (blue) and surround (red) direction tuning curves. Before averaging, the tuning curves of each neuron were normalized and rotated so that the preferred direction of the center was 90° (up) and the magnitude of the response to this direction was 1. B, Histogram of mean vector lengths for center (blue) and surround (red) direction tuning curves. The darker red bars indicate neurons whose surrounds were not significantly direction selective. C, Fraction of surround suppression from nonpreferred directions versus the difference in suppression index between the high and low coherence conditions. The black line is the regression line (r = −0.76; p <0.001). D, Histogram of preferred surround directions for neurons with significantly tuned surrounds. This distribution did not differ significantly from circular uniformity (Rayleigh’s test, p =0.23).

