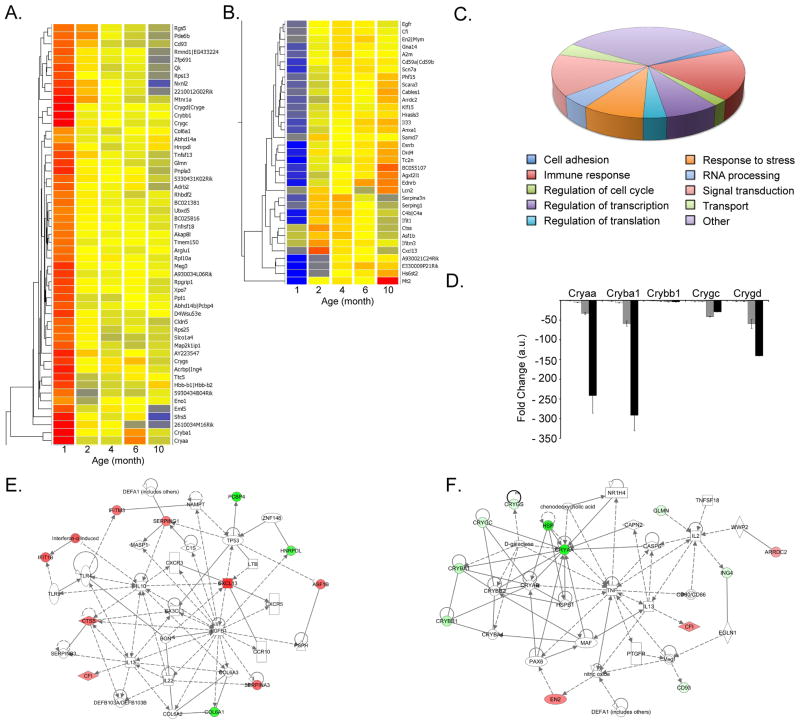
Figure 9. Gene expression analysis of Nrl−/− retina.
(A–B) Hierarchical clustering dendrogram of 350 genes having a False Discovery Rate (FDR) p≤0.05 and a minimum fold change 2 between 2- or 4-mon compared to 1-mon. Bright blue indicates lowest signal with increasing expression by yellow to bright red. (C) Chart pie representation of the main biological function representing 88 genes differentially expressed. (D) qRT-PCR validation of Cryαa, Cryβa1, Cryβb1, Cryγc and Cryγd using 4 individual biological replicates at 1, 2, 4, 6 and 10-mon. Bars indicate ±SEM. (E) Network reconstruction using Ingenuity Pathway Analysis (IPA) with 13 genes having a False Discovery Rate (FDR) p≤0.05 and a minimum fold change 2 only between 2 or 4-mon compared to 1-mon. (F) Network reconstruction using IPA with 39 genes identified as differentially expressed between 2 or 4-mon compared to 1 month after comparison with microarray and RNAseq analysis. Red indicates upregulation of the gene of interest at 2-mon compared to 1-mon; green indicates downregulation of the gene of interest at 2-mon compared to 1-mon.

