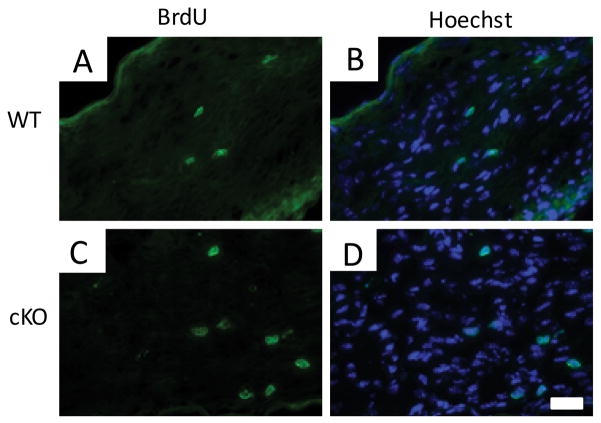
Figure 4. Persistence of Schwann cell proliferation.
(A–D). BrdU immunohistochemical analysis of P8 Chd4 cko sciatic nerve demonstrates an increased number of proliferating cells compared to control littermates. The BrdU positive nuclei were counted and proliferation was determined as a percentage of BrdU positive nuclei to compared to all hoechst stained nuclei in the nerve section. Scale Bar: 30μm (p< 0.019, n=3 for each genotype).

