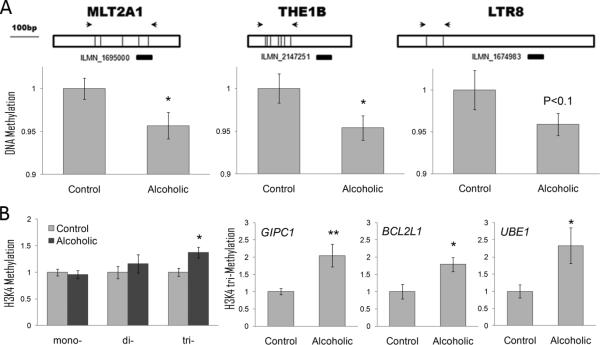
Figure 6.

Epigenetic modifications in alcoholic cortex. A. DNA hypomethylation is associated with higher expression of LTR retrotransposons in alcoholics. Top panel: Schematic diagram of three families of LTR (MLT2A1, THE1B and LTR8). Illumina probes shown below as black bars can detect expression of these classes of LTRs and were up-regulated in alcoholic brain (Fold Change range from 20 to 48%; P value range from 0.007 to 0.03). Arrows show locations of RT-PCR primers used for DNA methylation assays. DNA methylation shown as fold change compared to control group was measured using a combination of DNA digestion with a methylation-sensitive enzyme and qRT-PCR. B. Tri-methylation of histone 3 Lysine 4 (H3K4me3) shown as fold change compared to control group is increased in alcoholics. Left panel: Global methylation of H3K4 measured using a combination of chromatin immunoprecipitation (ChIP) and qRT-PCR. Three right panels: H3K4me3 levels at the promoter of three hub genes from the ctx7 GC-rich module (gene symbols are italicized). * = P < 0.05; ** = P < 0.01, as determined by a t-test.
