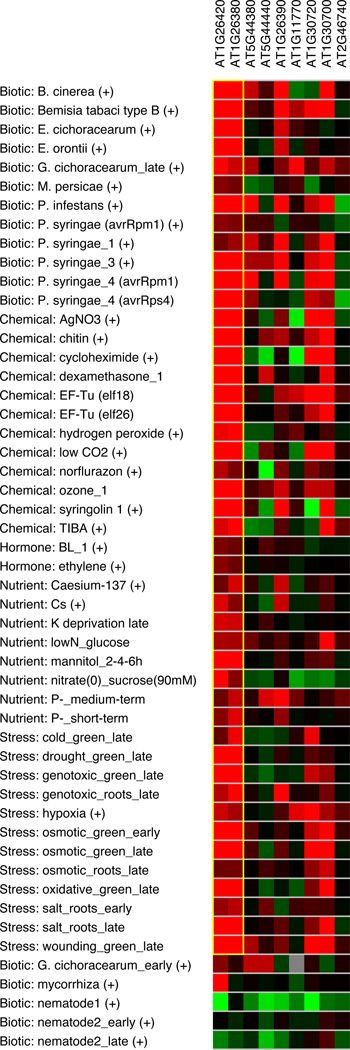
Figure 2.
BiMax clustering of FAD binding domain-containing genes. Red indicates induction and green indicates suppression, with brighter colors indicating greater effect of the indicated treatment. The yellow box indicates the two genes with highly similar expression patterns over the indicated treatments.

