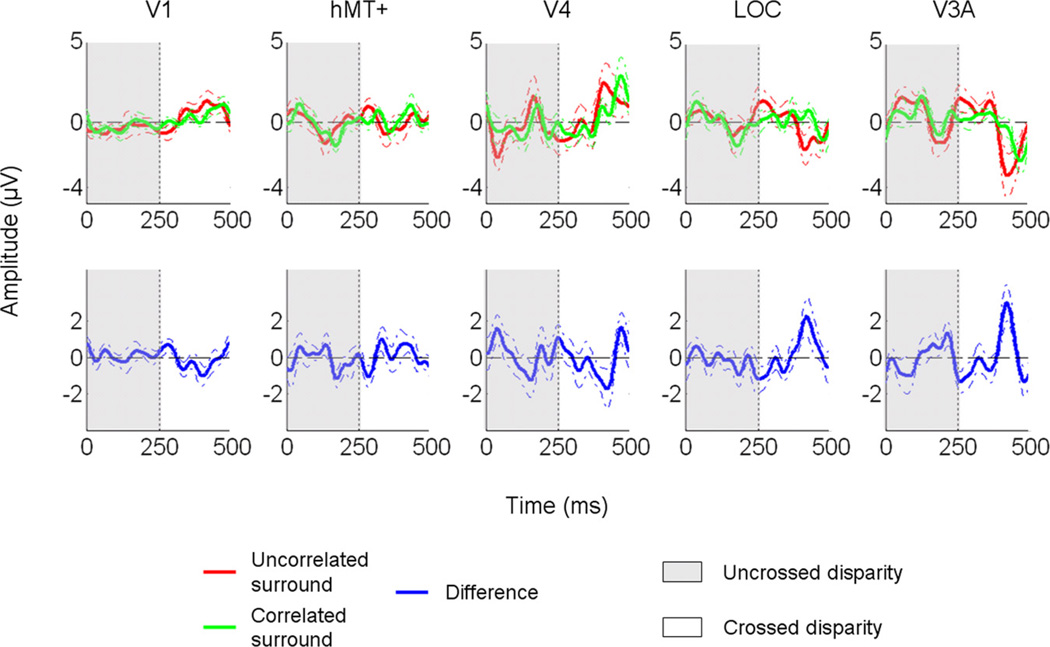
Figure 4.
Evoked response waveforms in the different ROIs (in microvolts) elicited by a disparity of 16 arcmin. The difference waveforms (blue) were obtained by subtracting for each subject sthe evoked responses associated with correlated and uncorrelated surround and averaging. The dotted lines give the SE. The time windows corresponding to the two perceptual states are indicated using different color codes: gray when the central disk is back from the fixation plan (uncrossed disparity at t1 = 0); and white when it is in front (crossed disparity at t2 = 250 ms).

