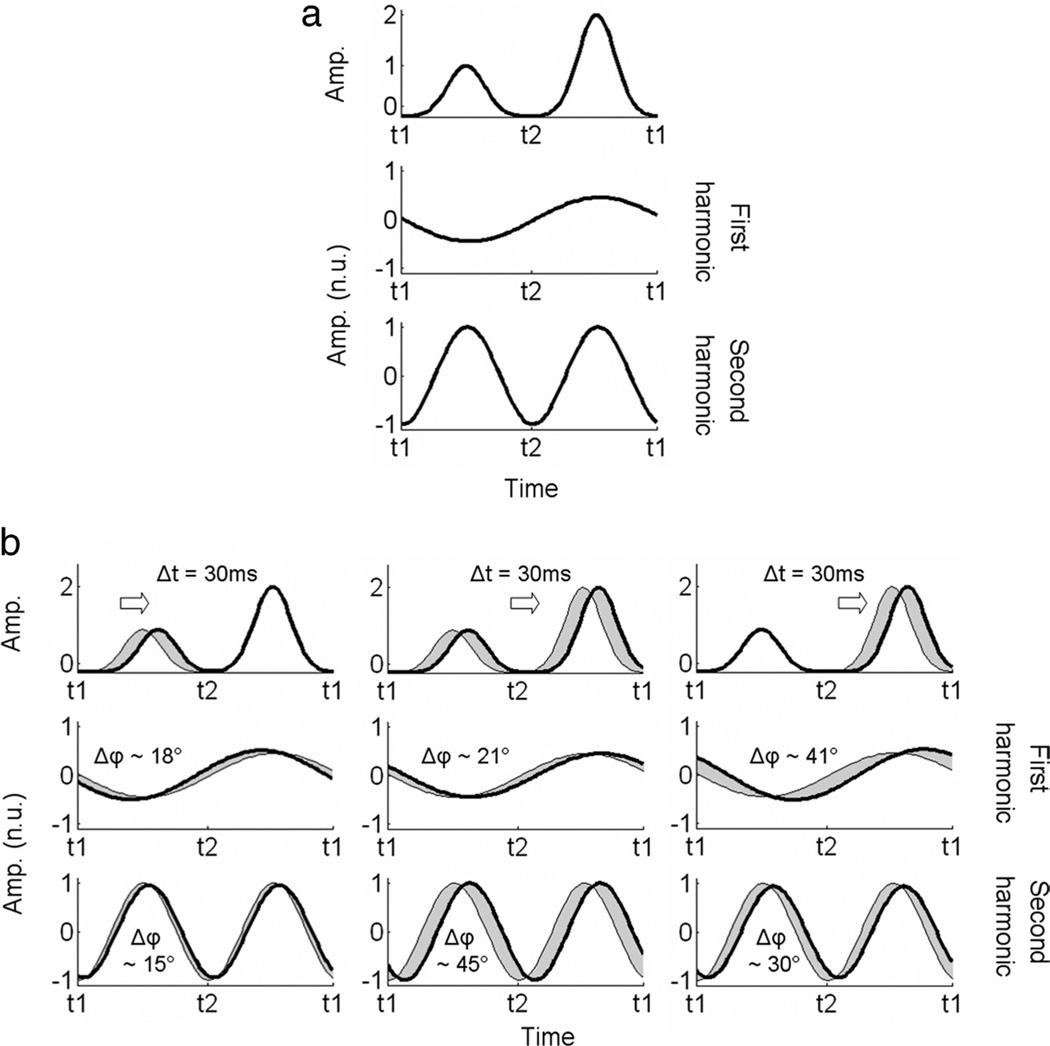
Figure 9.
Model of the odd and even harmonic phase variations between two experimental conditions. a, EEG signals associated with two subpopulations for a given condition (top) and its normalized reconstructions from its Fourier coefficients at the first (middle) and second harmonic (bottom). See Figure 6 for the details of the display. b, Effect of a time delay in the processing on the phase. Three different possibilities are examined. In the first one (b, left column), the correlation in the surround induces a delay of ~30 ms(equivalent to a phase lag of 45° at 4 Hz) only when the disk is in front of the fixation plane. This results in equivalent phase lags at both the first and second harmonics. In the second one (b, middle column), both uncrossed and crossed disparities are affected by the correlated surround, and phase lags appear at the first and second harmonics with a phase lag twice as large in the second harmonic. In the last one (b, right column), only the response to the crossed disparity are delayed, and both the first and second harmonics contain a phase lag with a more important value for the first one. Amp., Amplitude; n.u., normalized units.

