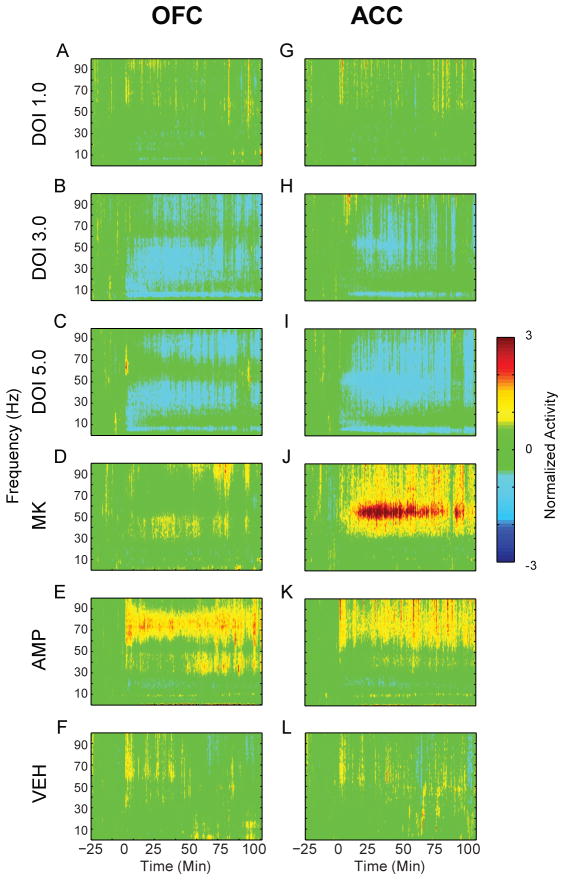
Figure 5.
Modulation of LFP power in OFC and ACC. (A–L) The normalized change in power of LFP oscillations in OFC (A–F) and ACC (G–L) before and after injection. Baseline activity is normalized to zero, and injection occurs at time = 0. The administered drug appears to the left of each row of spectrograms. Color scale appears at right.

