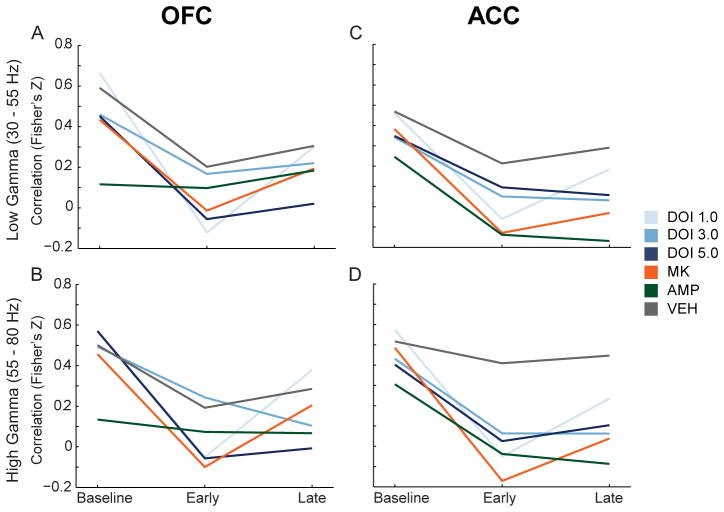
Figure 7.
Modulation of the correlation in gamma power and discharge rate in OFC and ACC. (A – B) The change in correlation between OFC single unit discharge rate and OFC low (A) and high (B) gamma power are depicted as mean Fisher’s Z score normalization of Pearson’s correlation coefficient for each group. The three time points represent baseline, early and late post-injection period. (C – D) The change in correlation between ACC single unit discharge and ACC low (C) and high (D) gamma power. Format same as (A – B). Legend appears at right, center of figure.

