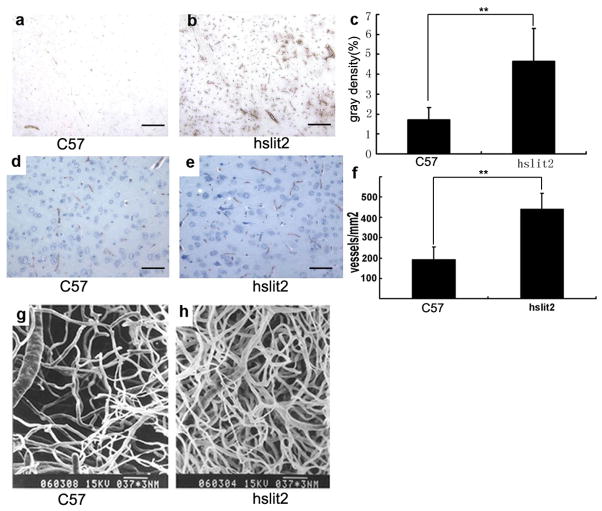
Figure 4. More vessels are present in the choroid plexus and the brain of transgenic mice.
a, b and c ICH of CD31 in C57 (a) and hSlit2 mice (b). Gray density statistics of CD31 staining (c), p<0.01. (scale bar: 150 μm).
d, e and f ICH of vWF in C57 (d) and hSlit2 mice (e). The difference in the number of stained vessels in the same area was statistically significant (f), p<0.01 (scale bar: 50 μm).<vr>g and h Scanning electron microscopy of corrosion casts of the brain vessel of C57 (g) and Slit2 mice (h).

