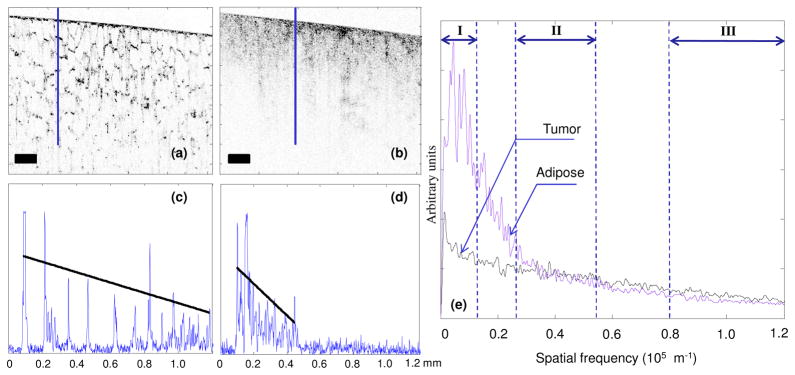
Fig. 2.
OCT image and data analysis from human breast (a) adipose tissue and (b) tumor tissue. (c) A-scan corresponding to the highlighted line from the adipose tissue. (d) A-scan corresponding to the highlighted line from the tumor tissue. (e) Normalized Fourier transforms (average of 150 A-scans). Roman numerals indicate the regions corresponding to the three spectral parameters. Scale bars represent 200 μm. The superimposed lines in (c) and (d) represent the 1st order fit to the A-scan for calculation of slope.

