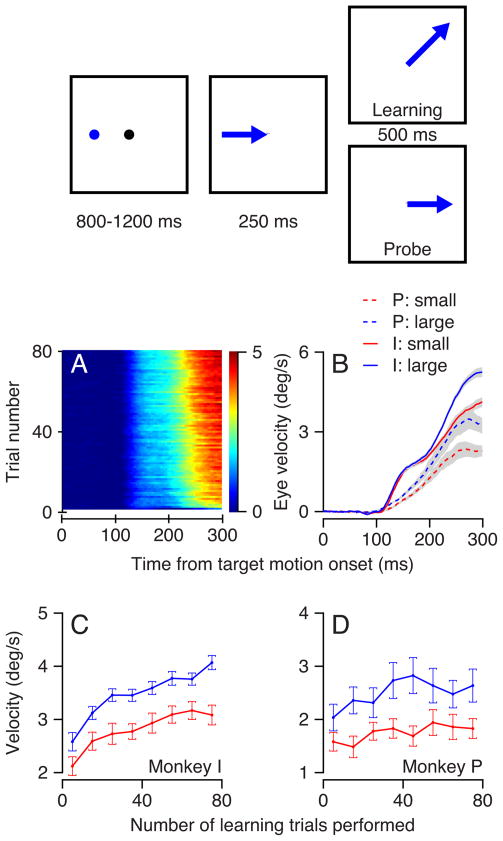
Figure 8.
Effect of reward size on the expression of directional learning in pursuit. The schematic at the top of the figure shows the structure of the learning paradigm, described in the text of the Results. A: The progression of the learned eye velocity averaged across all learning experiments of monkey I. Colors represent eye velocity in the learning direction and each horizontal line of the image shows eye velocity as a function of time for a single trial. The trials in a learning block progress from the bottom to the top of the image. B: The time course of the average eye velocity in the learning direction for the 50th trial to the end of learning block. Blue and red traces show results when the learning target motion cued and delivered large versus small rewards. Solid and dashed traces show data from monkeys I and P. The ribbons along the traces show the standard error of the mean across experiments. C, D: Learning curves showing the acquisition of learned eye velocity in bins of 10 learning trials. Blue and red show experiments where the learning target received a large versus a small reward. Symbols and error bars indicate the mean and standard error across experiments for the eye velocity averaged across the interval from 200 to 300 ms after the onset of target motion.

