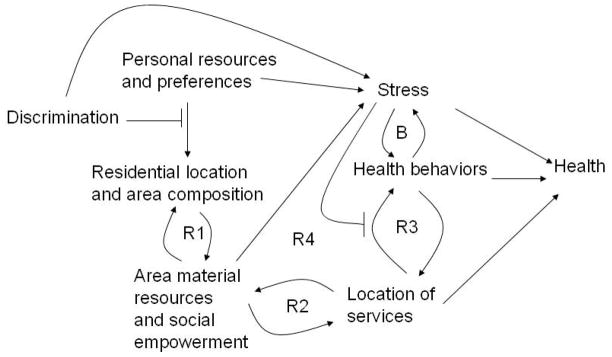
Figure 5.
Dynamic relations between area factors, individual-level factors, and health outcomes
The figures utilize a simple notation in which a single headed arrow for X to Y indicates that X is a cause of Y (e.g. family norms are causally related to physical activity) or that X causes increased exposure to Y (e.g. genetic factors related to exercise predisposition affect selection into exercise promoting environments). A line intersecting a one headed arrow (in the form of a T) indicates that the factor modifies or modulates the relation between X and Y (effect modification in epidemiologic terms). For example in Figure 1 the T-shaped line from structural/physiologic changes that intersects the arrow from environment to gene expression indicates that the structural and physiologic changes modify or modulate the effect of environments on gene expression. Analogously, in figure 5 discrimination modifies the relation between personal resources/preferences and residential location; and stress modifies the relation between location of services and behaviors. Classic positive or negative feedback loops are indicated with an R (reinforcing) or a B (balancing). Reinforcing loops promote or reinforce change in one direction. Balancing loops tend to close the gap between the current state and the desired state (e.g. increases in stress result in health behaviors which reduce stress levels bringing the body back into its desired state). See text for explanation of specific R and B loops. In order to keep figures simple and because variables are not always quantitative, directionality (plus or minus signs associated with the arrows) is not indicated in the figures but the types of relations can be inferred from the description in the text.

