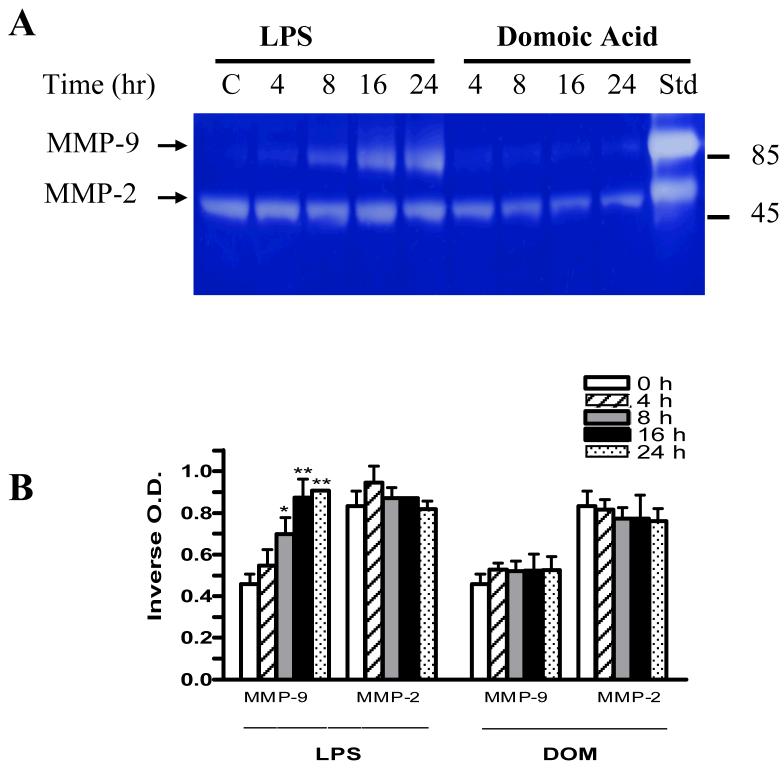
Figure 10.
The time-course of MMP-2 and MMP-9 expression in rat neonatal microglia cultured in the presence of LPS or DOM. MMP-2 and MMP-9 were determined as described in Experimental. (A) SDS-PAGE zymography, (B) bar-graph depicting the quantitated results. Rat neonatal microglia (2.8-5 × 10⁶ cells/culture dish) were treated with LPS [3 ng/ml] or DOM [1 mM] for 4 to 24 hours. Data (inverse O.D. units) are expressed as mean ± SE of 2 independent experiments. *p < 0.05 or **p < 0.01 vs. vehicle control.

