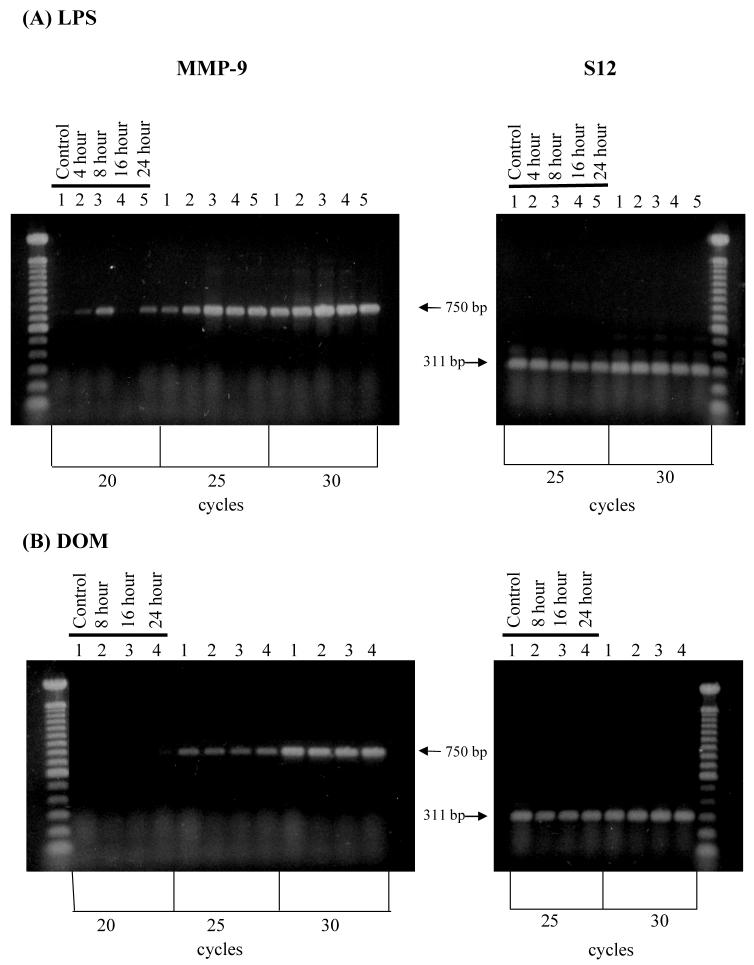
Figure 8.
RT-PCR analysis of MMP-9 gene expression in rat neonatal microglia after in vitro treatment with LPS or DOM. Rat neonatal microglia (2.8-5.0 × 10⁶ cells/culture dish) were treated with (A) LPS [3 ng/mL] or (B) DOM [1mM] for 4 to 24 hours as described in Experimental. Amplification of MMP-9 and S12 mRNAs showed the predicted cDNA size after separation on a 1.5 % agarose gel and visualization by SYBRR Gold nucleic acid staining. The S12 ribosomal RNA gene product was amplified for 25 and 30 cycles and demonstrated equal loading of the gels. Quantification of the MMP-9 product was done after 25 cycles shown to be in the linear range. The figure depicts one of two similar experiments.

