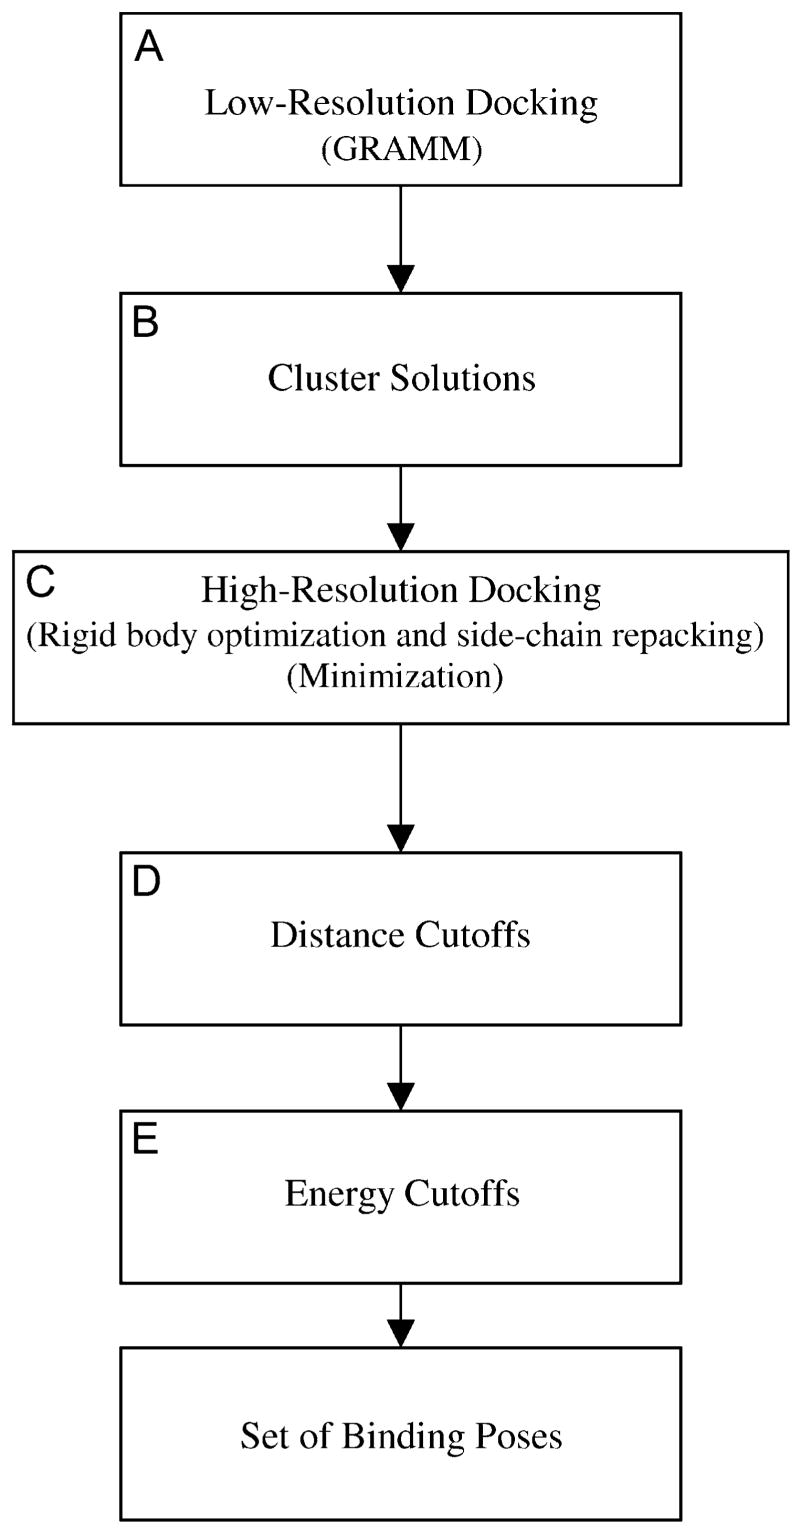
FIGURE 1.
Flow chart of the docking procedure. (A) Low-resolution docking, which involved the GRAMM program. (B) The solutions from GRAMM were clustered at 3 Å. (C) High-resolution docking, which included an iterative rigid body and side-chain optimization followed by minimization. (D) Distance cutoffs were imposed. (E) Energy cutoffs were imposed.

