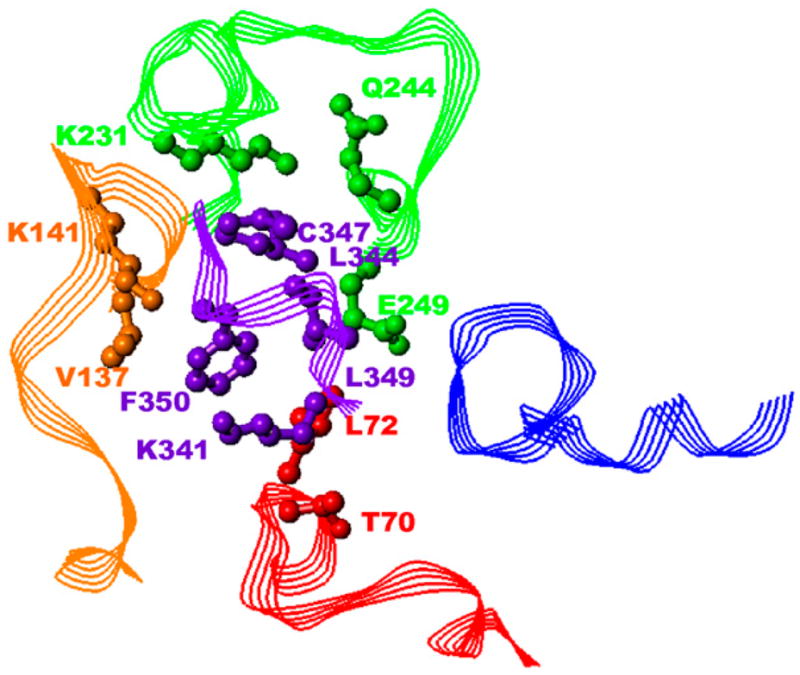
FIGURE 4.

Common residue-residue interaction at 5.5 Å. Gtα(340–350) is shown in purple, IC1 in red, IC2 in orange, IC3 in green, and IC4 in blue. Only side chains are shown. The side chains of residues involved in interactions are rendered in ball-and-stick format to better illustrate the interaction. All hydrogen atoms are omitted for clarity. The residues are labeled in corresponding color.
