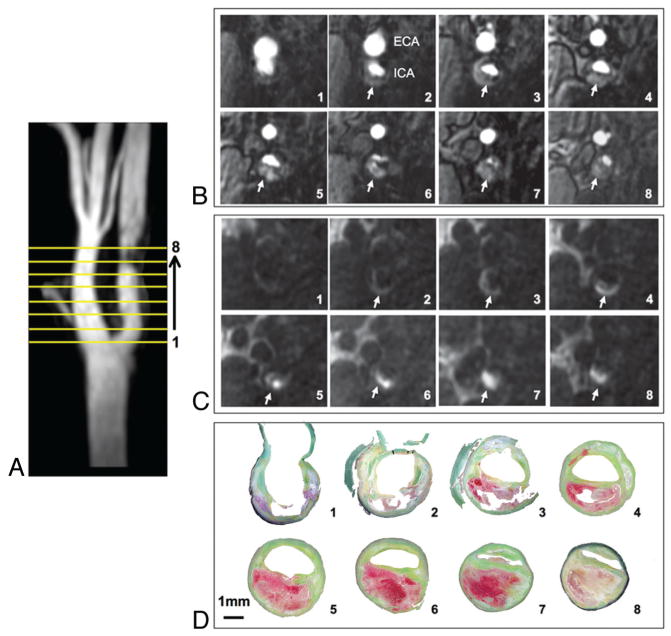
Fig 1.
Coregistration of MRA and histologic images. MIP image from the TOF-MRA that profiles the narrowed lumen contour (A) used to show the position of 8 reformatted TOF (B) and CE-MRA mask (C) sections (reconstructed thickness, 2 mm), to orient transverse 5- mu;m histologic sections through the specimen (D). IPH is identified as hyperintense signal intensity compared with adjacent muscle on MRA images (arrows, B and C) and is red on histologic sections (D) stained with Movat pentachrome.

