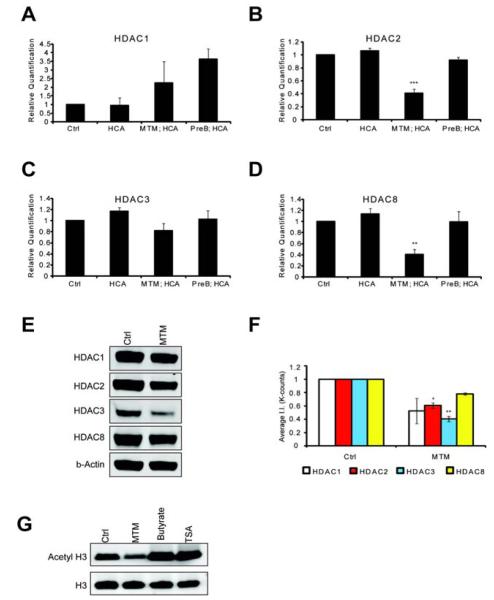
Figure 3.
MTM affects class 1 HDAC expression levels.
Real time RTPCR shows that MTM (300 nM) does not significantly affect HDAC1 (A) and HDAC3 (C) expression levels; whereas it significantly reduces HDAC2 (B) and HDAC8 (D) expression levels. These changes covary with neuroprotection by MTM as the non-protective analog PreB (300 nM) has no effect on the expression of these genes. Cells were treated for five hours and the experiments were repeated three times. (E): Western Blots show that MTM treatment reduces the protein levels of class 1 HDACs. (F): Quantification of three different western blots reveals that only HDAC2 and HDAC3 protein levels are significantly affected by MTM treatment. (G): Unlike sodium butyrate (5 mM) and TSA (0.66 μM), MTM does not induce acetylation of histone H3. For the western blot experiments, cells were treated with the compounds for 48 hours and experiments were repeated three times. Statistical analysis was conducted by 1way ANOVA followed by the Dunnett post test. Significant levels compared to control treatment alone. *: p < 0.05 and **: p < 0.01 and ***: p < 0.0001.

