
Fig. 11.
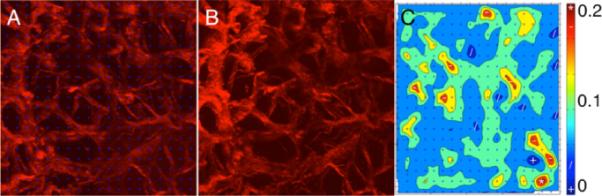
Digital image correlation analysis (DIC): (A) section of the LC at 5 mm Hg with blue markers from the DIC program, (B) the same region at 30 mm Hg, but without markers, and (C) the first principal strain as quantified from DIC
Official websites use .gov
A
.gov website belongs to an official
government organization in the United States.
Secure .gov websites use HTTPS
A lock (
) or https:// means you've safely
connected to the .gov website. Share sensitive
information only on official, secure websites.
Digital image correlation analysis (DIC): (A) section of the LC at 5 mm Hg with blue markers from the DIC program, (B) the same region at 30 mm Hg, but without markers, and (C) the first principal strain as quantified from DIC