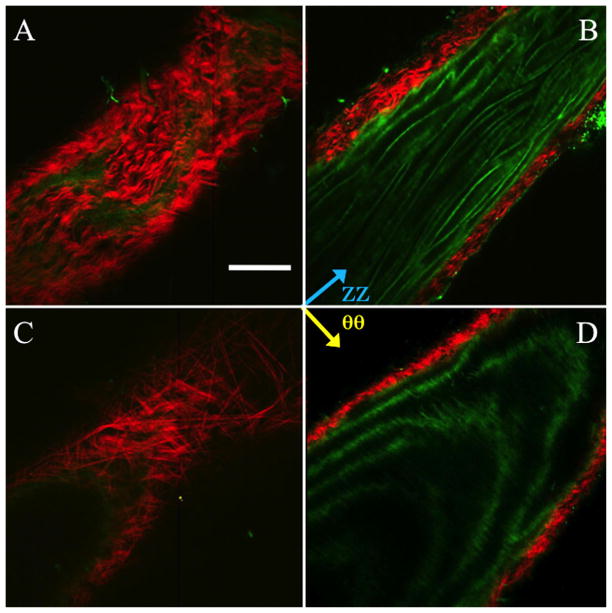
Fig. 7.
Representative multiphoton images of the mouse aorta in the unpressurized (a and b) and pressurized (c and d) states. (a) and (c) show the vessel near the outside of the thickness, (b) and (d) show the vessel towards the intima. Red is SHG signal (collagen), green is autofluorescence (elastin). Scale bar is 100 μm.

