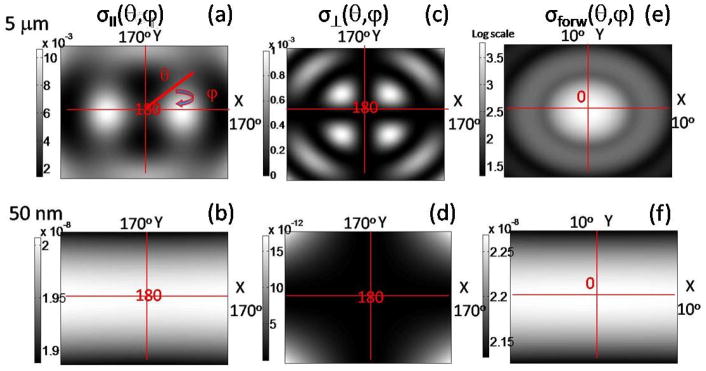
Fig. 1.
Polar plots of differential scattering cross-section σ as a function of scattering angles θ and ϕ (Mie simulation). Color bar is the magnitude of the differential cross-section in μm2/sr. Origin of the maps is either 0° (forward scattering) or 180° (backscattering). Top row for 5 μm-size particle. Bottom row for 50 nm-size particle. (a,b) Backscattering parallel cross-section. (c,d) Backscattering perpendicular cross-section. (e,f) Forward scattering cross-section.

