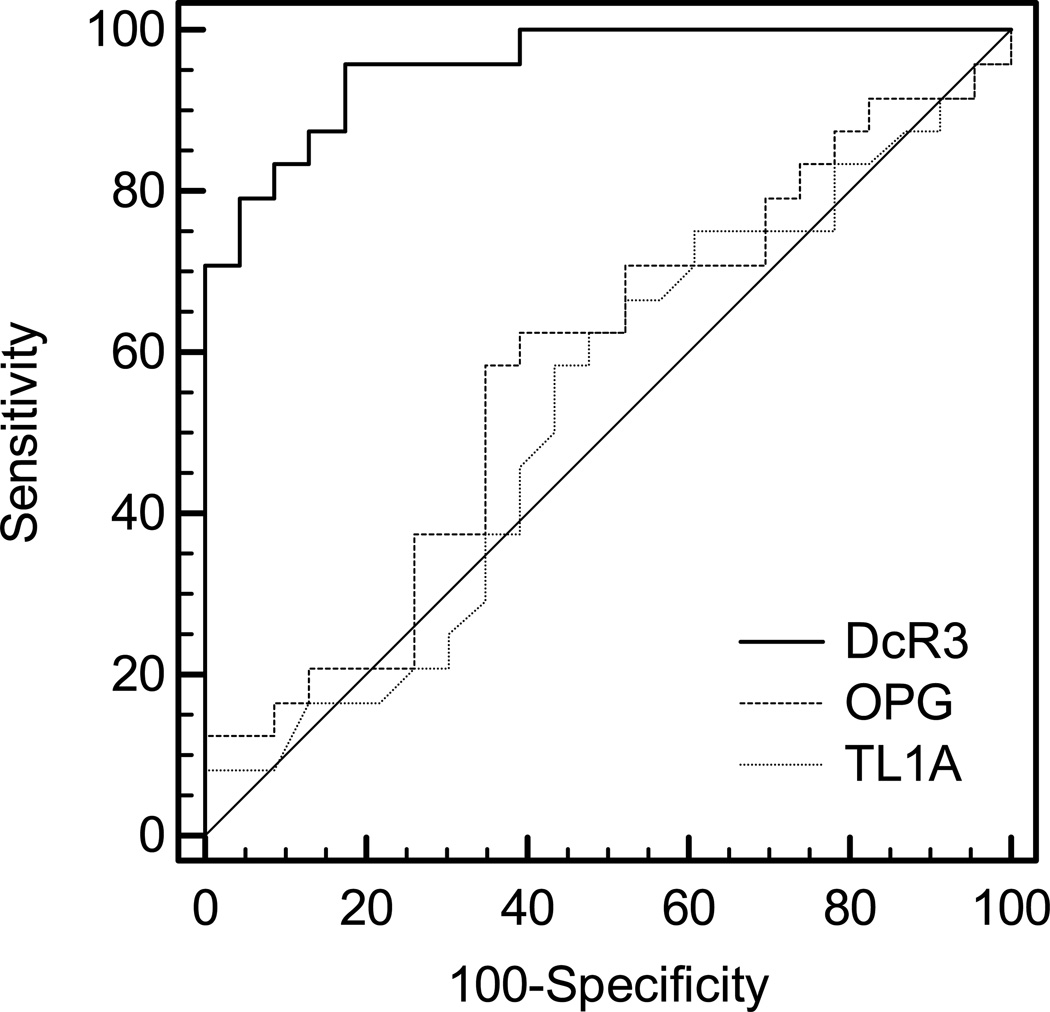
Figure 3.
Comparison of receiver operating characteristic (ROC) curves for DcR3, OPG, and TL1A in predicting sepsis from SIRS. Areas under the ROC curve (AUC) for DcR3, OPG, and TL1A were 0.958 (95% confidence interval [CI]: 0.857 ~ 0.995), 0.578 (95% CI: 0.425 ~ 0.720) and 0.528 (95% CI: 0.377 ~ 0.675), respectively. P values of DcR3 vs OPG and DcR3 vs TL1A were <0.0001 while p value between OPG and TL1A was 0.7280.

