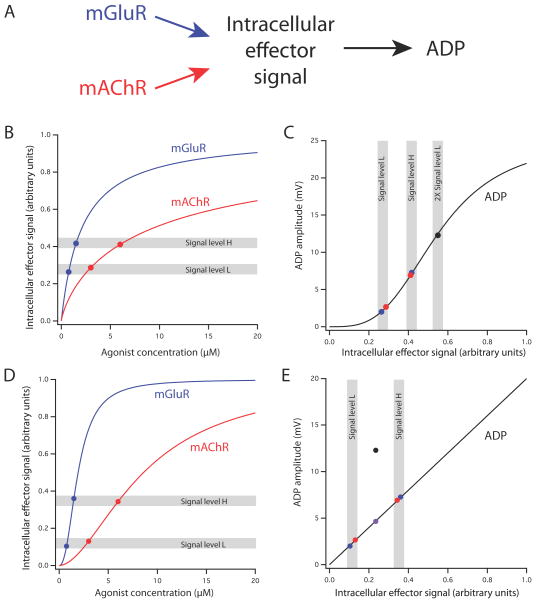
Figure 7. A mathematical model of synergistic activation of the ADP by mGluR and mAChR.
(A) Schematic representation of the model. Activation of mGluR and mAChR results in nonlinear activation of an intracellular effector signal (e.g., PLC or IP3). This signal in turn results in nonlinear activation of the ADP. (B) Hypothetical concentration-response curves of the intracellular effector signal for agonists of mGluR (blue) and mAChR (red). Both curves were generated by the Hill equation (see Methods; mGluR, Hill coefficient, n=1, microscopic dissociation constant, K=2.1 μM; mAChR, n=0.8, K=9.4 μM). The two curves were constructed such that each function is sublinear over the range of concentrations used in the experiments (0.75 μM and 1.5 μM for mGluR; 3 μM and 6 μM for mAChR) and the low concentrations and high concentrations produced effector signal levels (indicated by gray bands L and H, respectively) that were approximately equal for the two agonists. This combination of functions produces a good fit of the data, including the synergistic mGluR/mAChR response. (C) Hypothetical concentration-response curve for the ADP produced by the intracellular effector signal (Hill equation, n=3.3, K=0.55 μM). Data points correspond to actual ADP response means shown in Fig. 6C (mGluR, blue; mAChR, red; Both together, black). Gray bands indicate signal levels shown in panel A, including two times (2X) signal level L. (D) Hypothetical concentration-response curves of the intracellular effector signal for agonists of mGluR (blue) and mAChR (red). Both curves were generated by the Hill equation (see Methods; mGluR, Hill coefficient, n=2.3, microscopic dissociation constant, K=1.9 μM; mAChR, n=1.8, K=8.6 μM). The two curves were constructed such that each function is supralinear over the range of concentrations used in the experiments. (E) Hypothetical linear concentration-response curve for the ADP produced by the intracellular effector signal. This model can explain the separate mGluR and mAChR data, as well as the linear sum (purple point), but not the synergistic mGluR/mAChR response.

