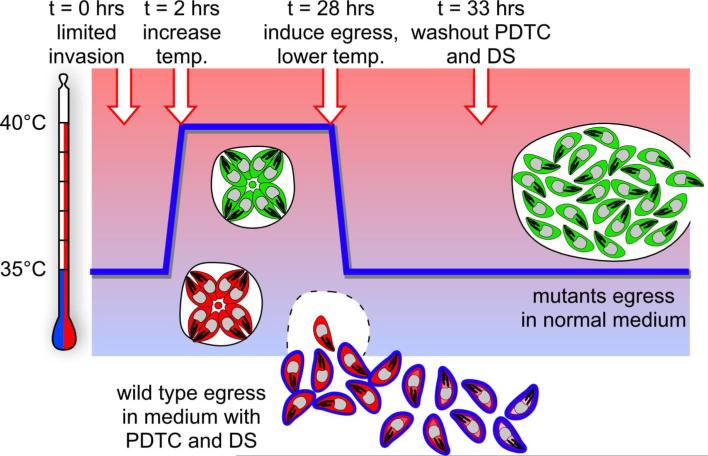
Figure 2. Schematic representation of the egress mutant enrichment screen.
Temperature is indicated on the y-axis, whereas time progression is represented by the x-axis. Green parasites reflect egress mutant parasites, red parasites reflect wildtype parasites. The timing of changes in conditions and stimulation by egress inducer are indicated at the top and are marked by arrows on the blue line reflecting the temperature profile. Adopted from Eidell et al.13.

