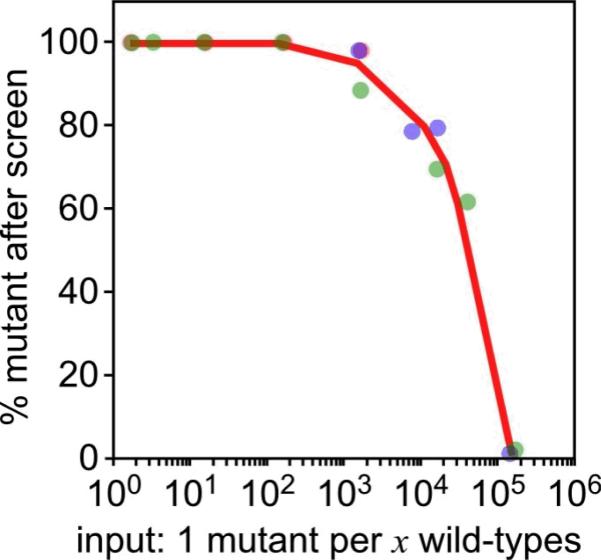
Figure 3. Typical enrichment of egress mutant phenotypes.
Enrichment results of an egress mutant mixed into wild-type parasites at various ratios (x-axis). The percentage of egress mutant phenotypes in the population grown up after the screen is plotted on the y-axis and was assessed by flow cytometry (egress mutant parasites expressed cytoplasmic YFP, wild-type parasites expressed cytoplasmic RFP). Results of three independent experiments are represented by red, blue and green data points. Adopted from Eidell et al.13.

