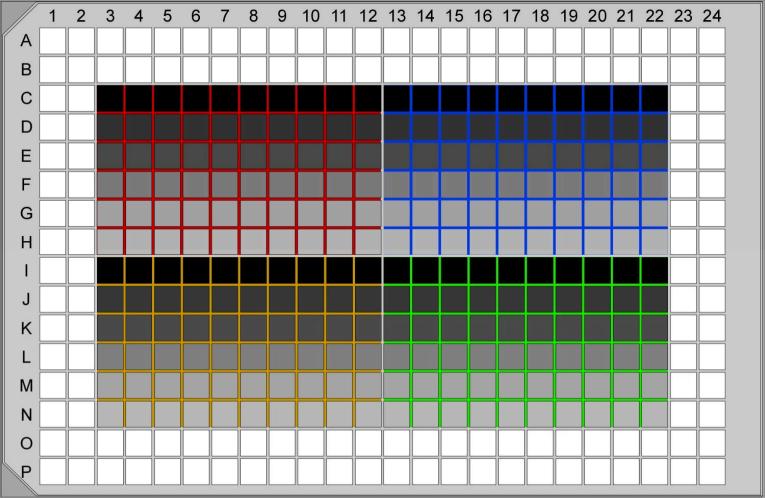
Figure 5. Serial dilution for clonal parasite lines.
Four polyclonal populations (red, blue, yellow, green) are serially diluted in a single 384-well plate confluent with HFF cells. Row C and I receive 10 parasites per well and are 2-fold diluted (40 μl + 40 μl) until rows H and N, respectively. The shade of grey indicates the decreasing number of parasites per well. Typically, single clones are found in rows D-F and J-L.

