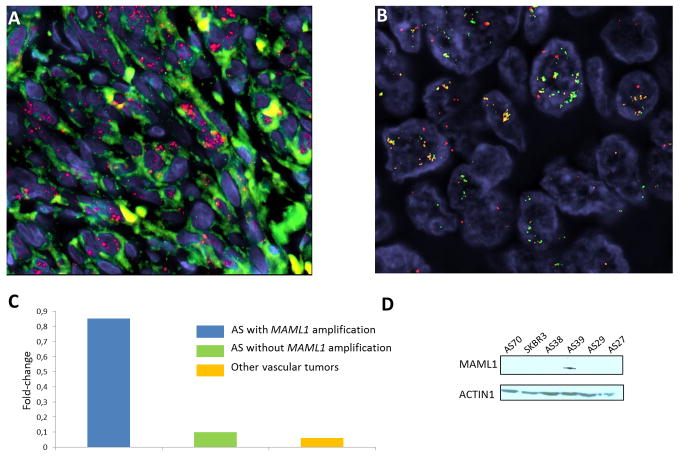
Figure 2.
MYC and MAML1 amplification in AS. (A) FISH analysis with BAC probes RP11-440N18 (MYC) and RP11-586L9 (FLT4) showing high level of MYC amplification (red signal) in a case of primary angiosarcoma (AS125). FLT4 (green signal) is not amplified. (B) FISH analysis with BAC probes RP11-828P1 (MAML1), RP11-586L9 (FLT4) and 5q33.3 region reference probes (RP11-583A20 and RP11-117N12; red) in a chronic lymphedema-associated AS (AS39). MAML1 (orange signal) and FLT4 (green signal) are co-amplified. (C) QRT-PCR analysis measuring MAML1 mRNA expression in AS with MAML1 gene amplification, in AS without MAML1 gene amplification and in other vascular tumors. Gene expression was quantified by QRT-PCR and expressed as mean relative expression (reference gene: GAPDH). (D) Western blotting assessing MAML1 protein expression in AS with MAML1 gene amplification (AS 39), in AS without MAML1 gene amplification (AS27, AS29, AS38, AS70) and in the SKBR3 breast cancer cell line.

