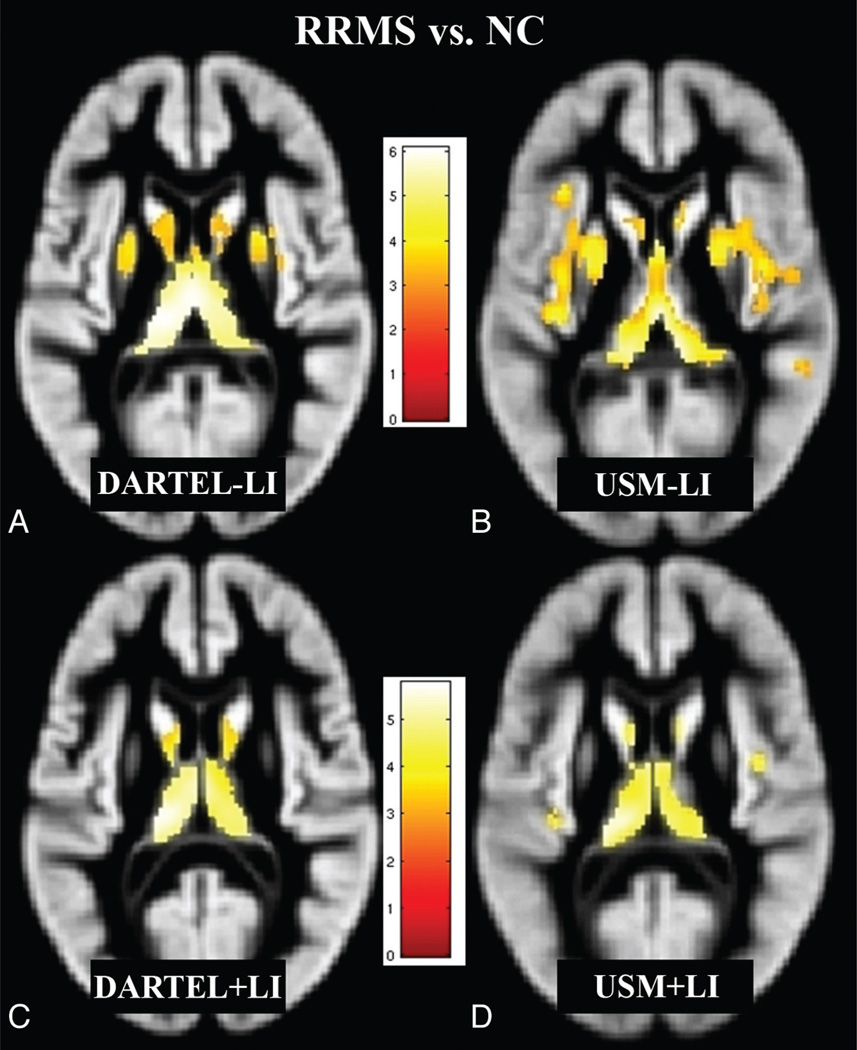
Fig 1.
Regions of decreased GM volume in patients with RRMS (n = 26) compared with NC (n = 28) (P < .05, corrected for multiple comparisons by using false discovery rate, cluster size >20), overlaid on a GM template (A–D). Comparisons of all 4 methods (DARTEL + LI, DARTEL − LI, USM + LI, and USM − LI) are illustrated. The pattern of GM atrophy in patients with RRMS shown by DARTEL is more focal, while with USM, it is more widespread. DARTEL + LI (C) likely yielded the most accurate results compared with DARTEL − LI (A), USM − LI (B), and USM + LI (D) (see “Discussion”). Bar is color-coded for t values. Images are presented in the neurologic convention (right side of image = right side of brain). See “Materials and Methods” and “Results” sections for more details.

