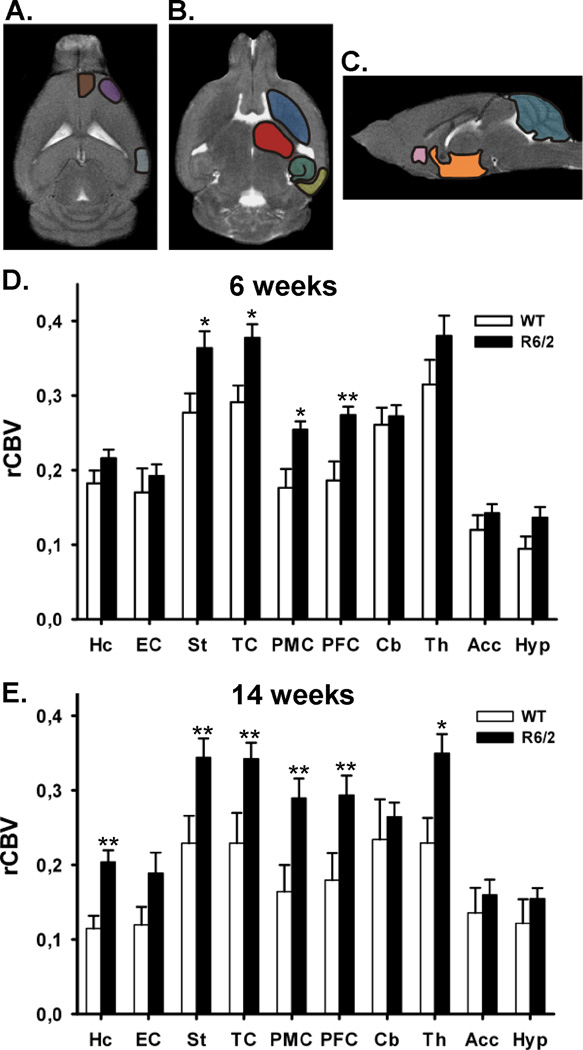
Figure 1. Abnormal cerebral blood volumes in HD mice.
Horizontal (A&B) and Sagittal (C) sections of T2-weighted images from a 6-week-old WT C57BL/6J mouse. Regions of interest were identified within: Hc [green], EC [yellow], St [dark blue], TC [grey], PMC [purple], PFC [brown], Cb [light blue], Th [red], Acc [pink] and Hyp [orange].
Mean normalized relative cerebral blood volumes (rCBVs) and SD were measured from each region of interest in R6/2 and WT mice in 6 week old (D) and 14 week old mice (E). Note that both at 6 and 14 weeks there were significant larger rCBV values in R6/2 mice, compared to WT in specific regions.
Hc= hippocampus, EC= entorhinal cortex, St= striatum,TC=temporal cortex, PMC=primary motor cortex, PFC=prefrontal cortex, Cb=cerebellum, Th=thalamus, Acc= accumbens and Hyp=hypothalamus. * denotes p value ≤0.05, and ** p value ≤0.01

