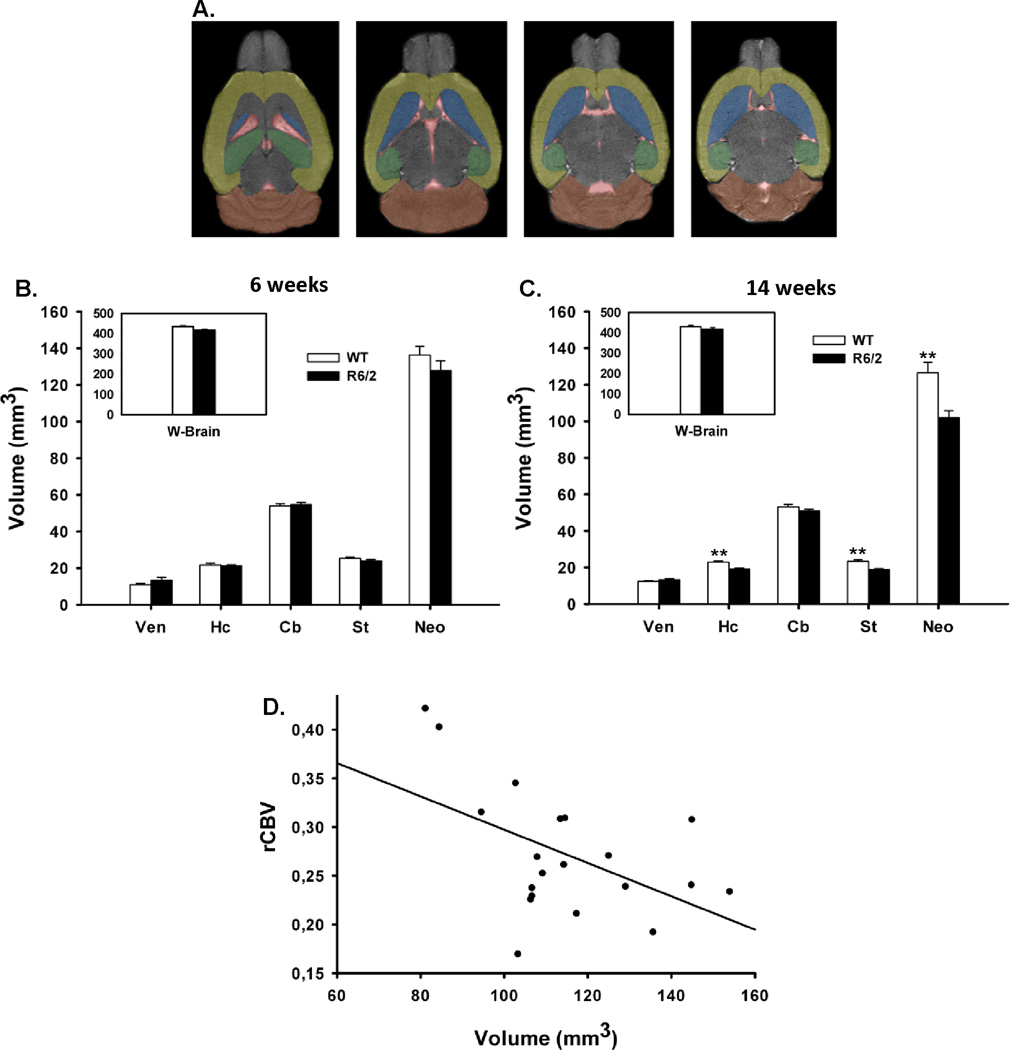
Figure 2. Volumetric analysis of R6/2 and WT mice.
A. Shown are horizontal sections of T2-weighted images from ventral to dorsal levels at 0.7 mm intervals, regions measured were: Ven [red], Hc [green], Cb [orange], St [blue], Neo [yellow] and WB. B. The volumes of R6/2 mice were not significantly different from WT controls in any of the brain regions analyzed at 6 weeks of age. C. The volumes of the neocortex, striatum and hippocampus were significantly smaller in 14-week-old R6/2 mice compared to WT. D. A significant inverse linear correlation was found between prefrontal cortex normalized rCBV values and neocortical volumes.
Mean volumes in mm3 and SD for the different areas. * denotes p value < 0.05. Ven=ventricles, Hc=hippocampus, Cb= cerebellum St=striatum, Neo=neocortex and WB=whole brain

