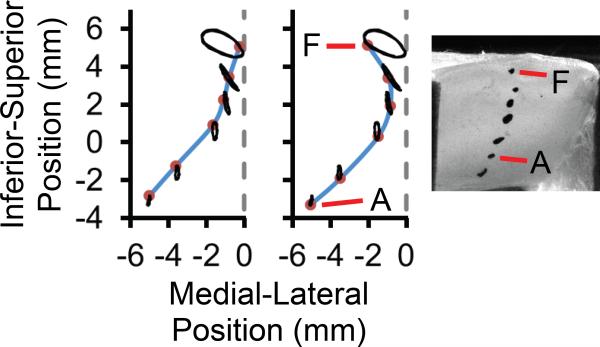
Figure 4.
Medial surface profile of synthetic vocal fold model in a hemilarynx arrangement, captured at two different instances of time while vibrating. Ink markers were placed on the medial surface (as shown in the right image), imaged using two synchronized high-speed cameras, and tracked over the vibratory cycle. The left plot shows a convergent glottis during the opening phase and the right plot shows a divergent glottis during the closing phase.

