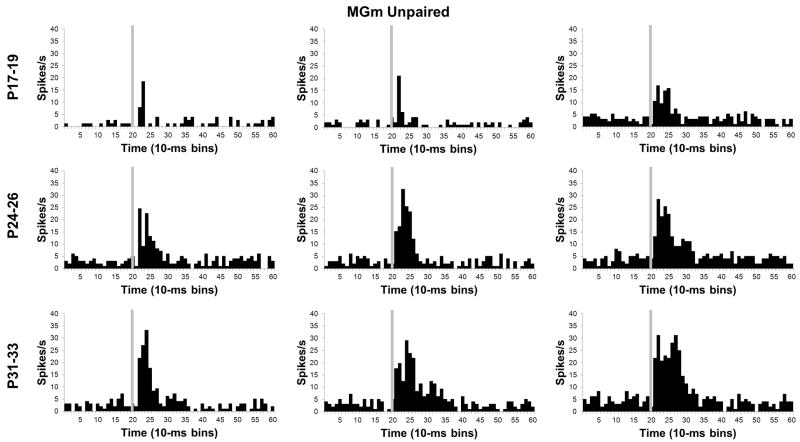
Figure 6.
Histograms of single neuron activity in the medial nucleus of the medial geniculate (MGm) during presentations of the 400 ms tone conditioned stimulus in the unpaired pre-training session. Three examples are displayed for the groups trained on postnatal days (P) 17–19 (upper row), 24–26 (middle row), or 31–33 (bottom row). Stimulus-elicited activity is greater in the neurons recorded from the older groups relative to the neurons recorded from the P17–19 group during the first 100 ms of the tone stimulus. Stimulus onset is depicted by the vertical gray line.

