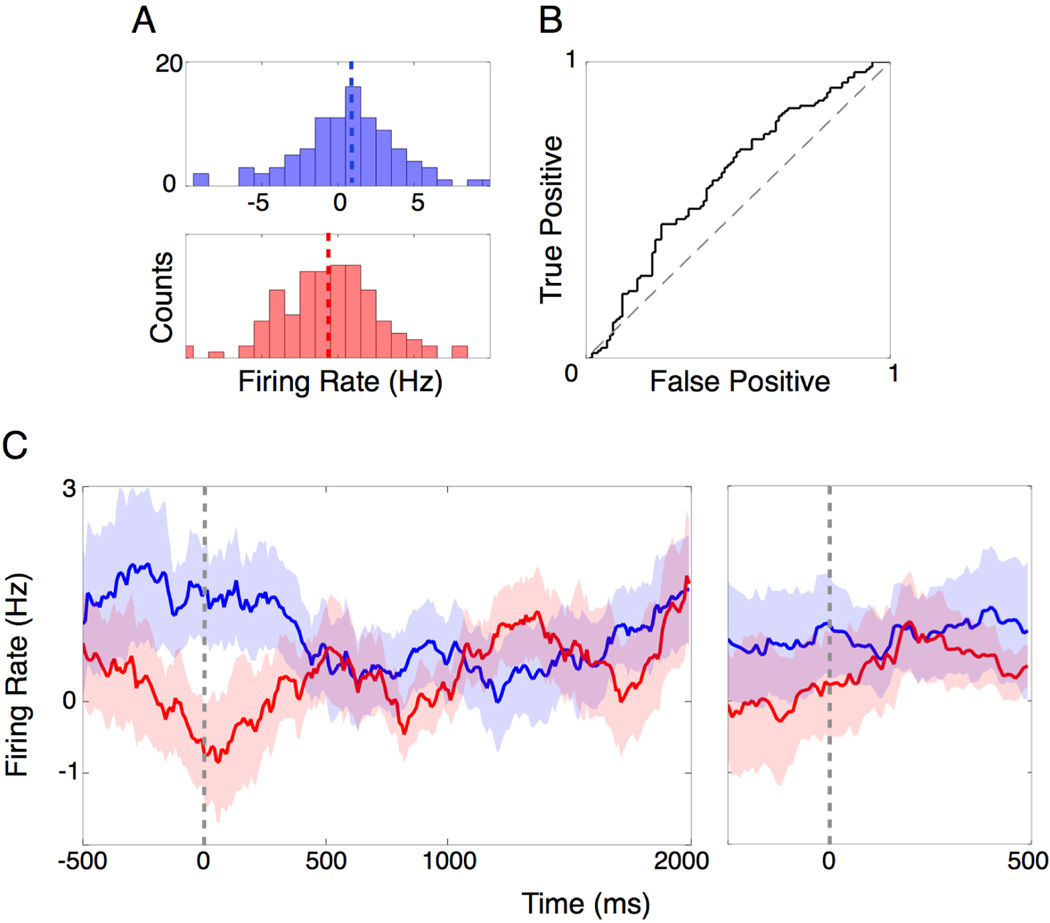
Fig 3.
Population response of NAc activity predicts wager at the go-cue for 6-card trials. Each trial was normalized to its pre-fixation baseline activity. (A) Histogram of average nucleus accumbens activity during the first 500 ms following the go-cue for trials in which the subject bet high (blue) or low (red). The mean activities for bet high and low trials are represented by the blue and red dashed lines, respectively. Axis limits are the same for the top and bottom panels. (B) ROC curve for bet high and bet low trials during the first 500 ms following the go-cue (ROC, a.u.c. = 0.62; p = 0.003, randomization test). (C) Continuous firing rate histograms for bet high (blue) and bet low (red) trials relative to go-cue (left panel) and choice (right panel).

