Figure 3.
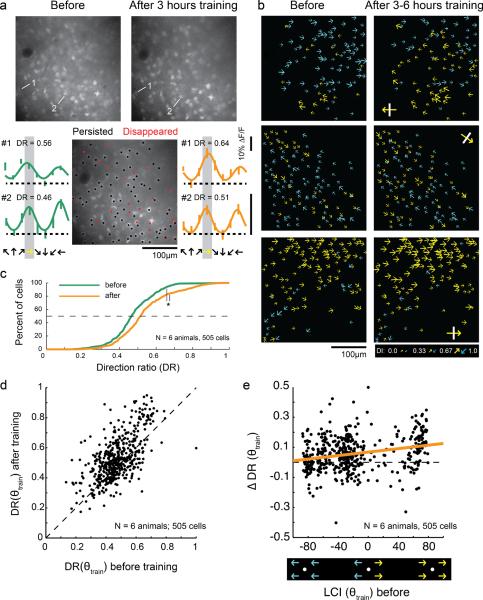
Motion training in a single direction increases responses to the trained direction. a) Top: Representative 2-photon images before and after unidirectional motion training. Bottom: Cell history (persisted/disappeared—see methods) over the course of training is depicted in the middle field. Individual tuning curves for 2 cells are shown before (left) and after (right) unidirectional training. Yellow arrows indicates trained direction in all panels. b) Plots of direction selectivity in individual cells before and after training. Yellow arrows indicate cells that preferred the training direction (within 180°); blue arrows indicate cells that preferred the opposite direction (within 180°). Yellow arrows with white bars indicate actual training direction. c) Direction ratio (DR) cumulative histogram before and after training (N=number of animals, number of cells) * indicates significant difference (t-test, p<0.001). d) DR before and after unidirectional training for individual cells. Dashed line indicates unity line. On average, cells with initial DR values greater than or less than 0.5 exhibited an increase in DR with training (t-test, p<0.001). e) Change in DR with unidirectional training as a function of initial local coherence index with respect to the trained direction (neighborhood size: 150μm). Cells with both positive and negative initial LCI(θtrain) values exhibited increases in selectivity for the trained direction (F-tests of regression line slope, p<0.001). Thick line is regression line.

