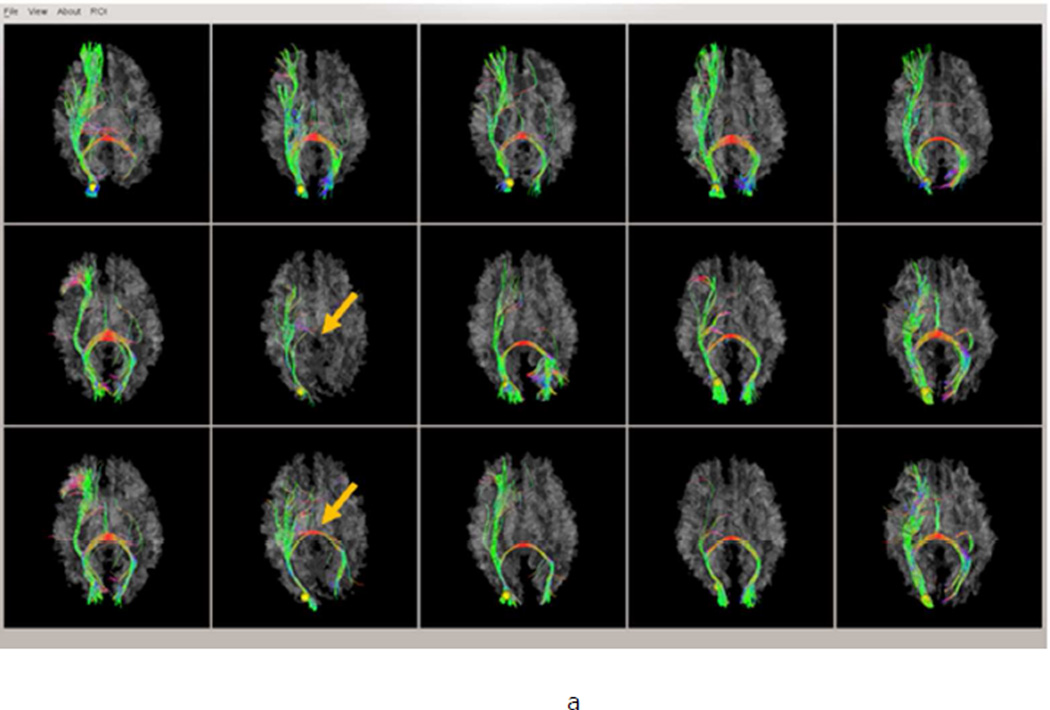
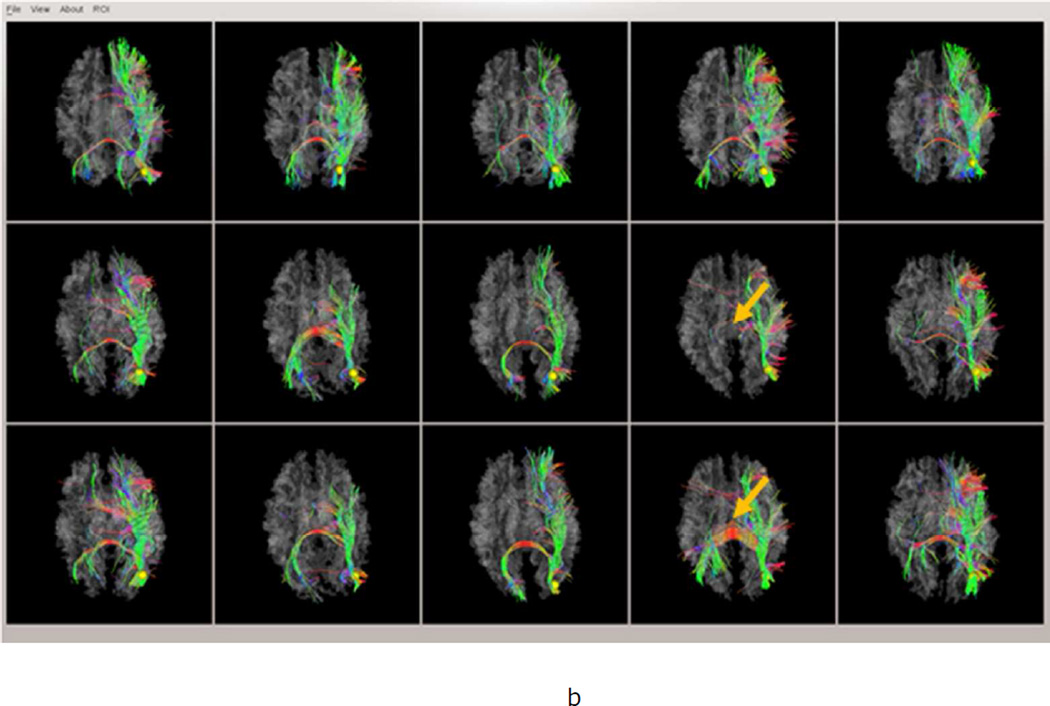
Fig.2.
Two examples of fiber connection patterns of DICCCOL ROIs before and after optimization. (a) The first case; (b) The second case. For each case, the 5 visualizations in the top row are from template brains, the 5 visualizations in the middle row are the predicted DICCCOL ROIs in PCE brains, and the 5 visualizations in the bottom row are the results after optimization. The within-group tracemap distances for the two examples are: (a) 2.30/1.67 (prediction/optimization), and (b) 3.86/1.92 (prediction/optimization). The orange arrows highlight the cases that exhibited significantly improved DICCCOL optimization results.


