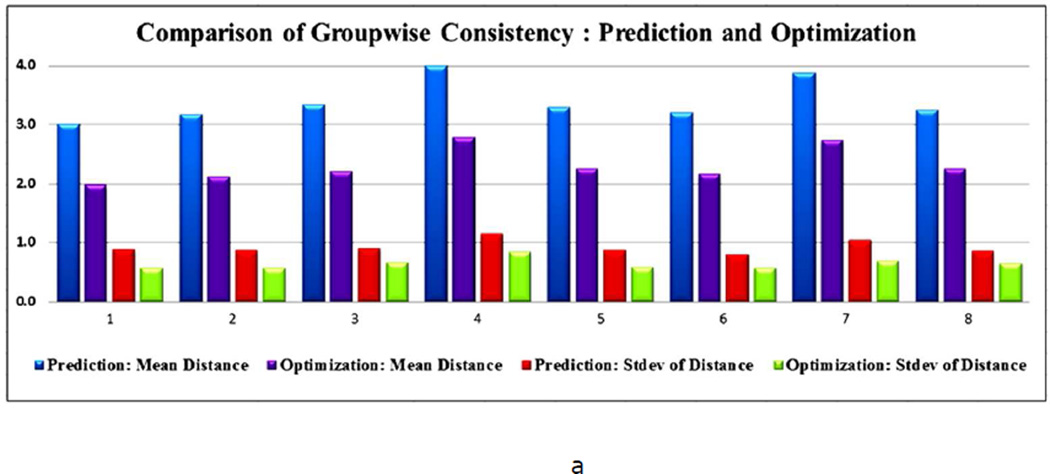
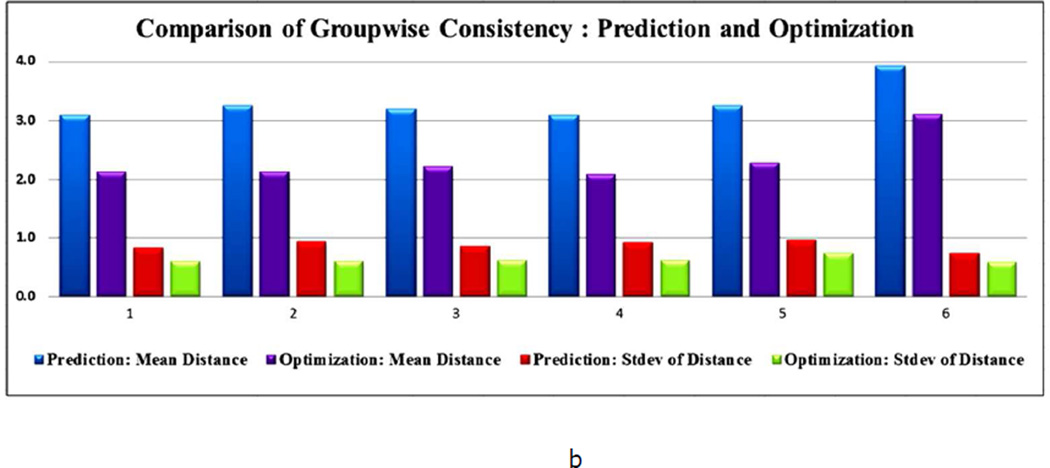
Fig.4.
Group-wise consistency comparison for DICCCOL-PCE ROIs. (a) PCE subjects. The average trace-map distance drops by 31.8% after optimization and the standard deviation drops by 30.1%. (b) Control subjects. The average trace-map distance drops by 29.8% after optimization and the standard deviation drops by 27.7%.


