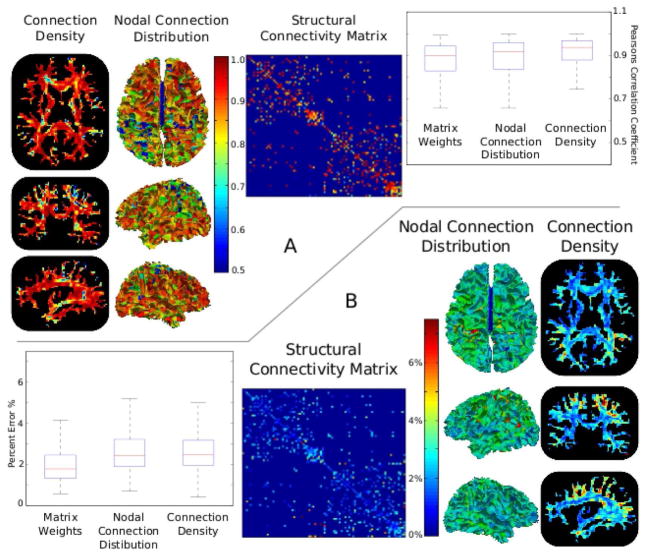
Figure 3.
Results from a test/retest study performed on nine subjects scanned at two time points two weeks apart. Pearson’s correlation coefficients computed from each WM voxel’s connection density value, each GM node’s nodal distribution value, and each non-zero (p<0.025) connection weight, are shown in A. B shows the percent error of each of these measures. The high correlation coefficients, typically above 0.75, and low percent errors are indicative of a highly repeatable measure.

