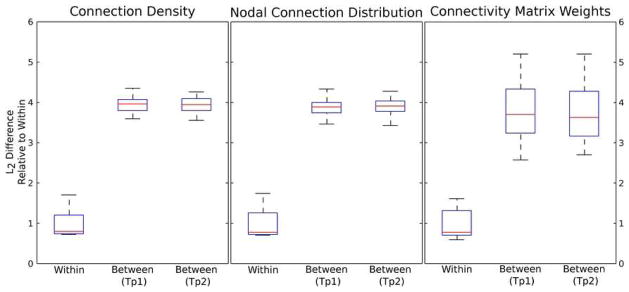
Figure 4.
Boxplots indicating the average L2 difference between connection density images, nodal distributions and connectivity matrices derived from the same subject (‘Within’) and different subjects at each time point (‘Between TP1 and TP2’). The average difference between subjects is roughly 4 times higher than the difference within the same subject, indicating that these measures are able to capture individual anatomy and may be able to reveal group differences.

