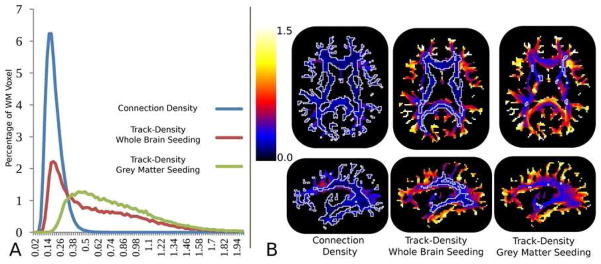
Figure 8.
Coefficient of variation (CV) histograms, are shown in A, computed from the WM voxels of the connection density images, whole brain seeded and GM seeded track density images. Representative slices of the CV images are shown in B where the white line delineates the CV thresholded at 0.25 contour indicating areas of low population variance.

