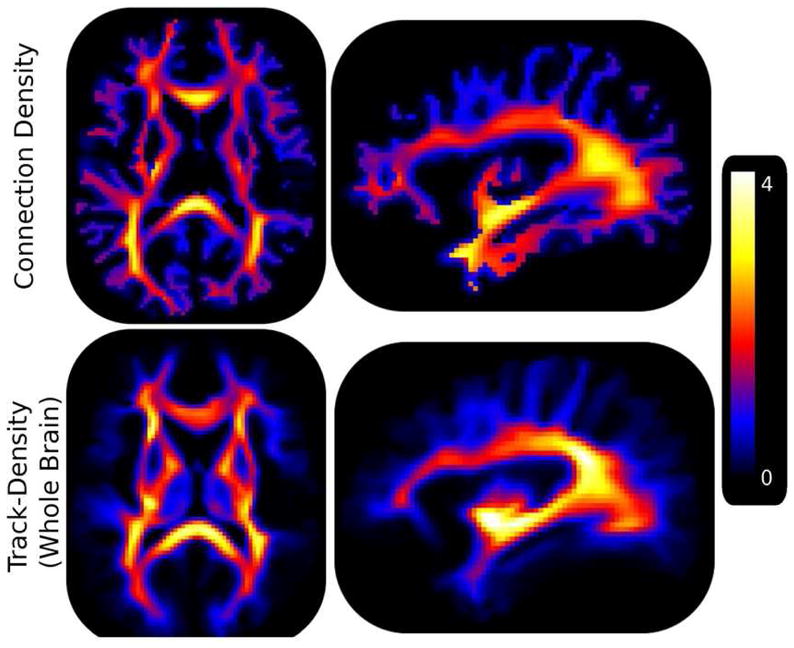
Figure 9.

Population averaged track density images generated by seeding in the whole brain and connection density images are shown. Note that for visualization purposes each image was scaled by the number of connections passing through the mid sagittal corpus callosum prior to computing the average. These results indicate the higher contrast of the proposed method in cortical WM pathways, which are critical to the investigation of diseases that affect local connectivity, such as autism.
