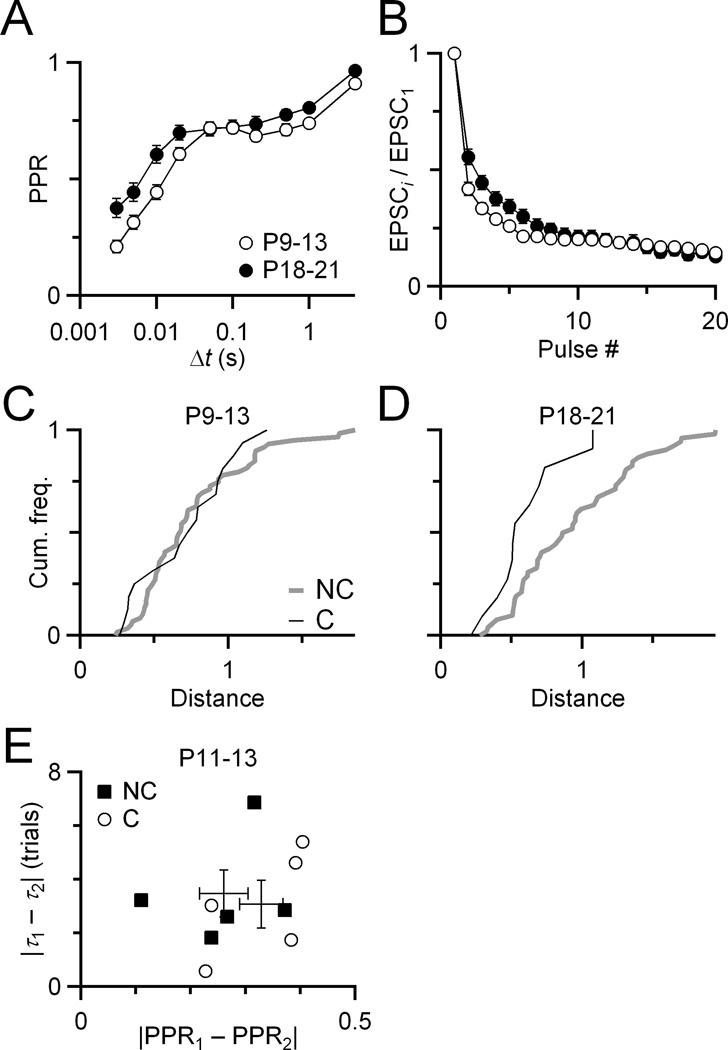
Figure 5.
Coordinated plasticity emerges after the onset of hearing. A,B, Plasticity changes over development, with a small decrease in depression seen both for pairs of pulses (A) and during 100 Hz trains (B). Data for P9–13 are from 17 endbulbs, and for P18–21 are from 12 endbulbs. C, Cumulative frequency plot of distance for converging and non-converging endbulbs before the onset of hearing. The two curves are not significantly different (K-S test, P > 0.5, NC = 17 pairs, NNC = 60 pairings). The distance metric includes PPR and 100 Hz trains measurements. For comparison, the same distance metric for endbulbs after the onset of hearing (D), which is significantly different (P < 0.04, NC = 12 pairs, NNC = 53 pairings). E, MK-801 experiment similar to Fig. 4, but in juvenile endbulbs. The converging and non-converging populations overlap considerably, indicating no particular similarity of endbulbs before the onset of hearing (P > 0.28, t-test, NC = 5 pairs, NNC = 5 pairs).

