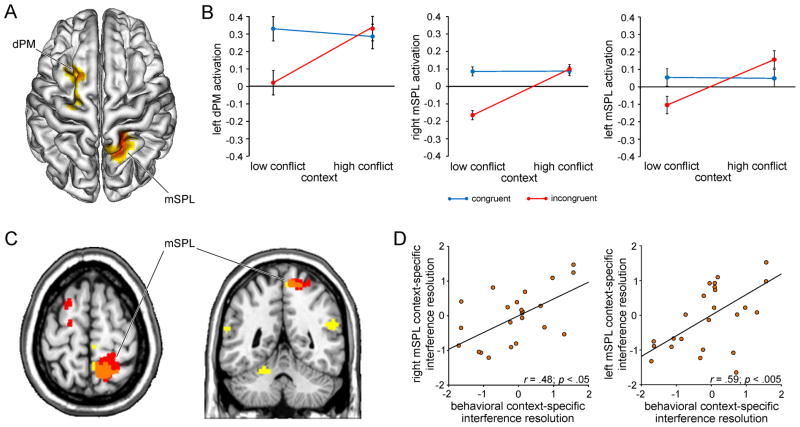
Figure 3.
Neural substrates of context-specific variation in conflict processing. A, Group-averaged T-map (p < .05, corrected) depicting activation associated with context-specific variation in conflict processing (interferencehigh-conflict context > interferencelow-conflict context) is plotted on a 3-D rendering of an individual brain normalized to the MNI template. dPM, dorsal premotor cortex; mSPL, medial superior parietal lobule. mSPL activation of comparable intensity was evident in the left hemisphere at an uncorrected extent threshold (x -12, y -58, z 62; Tmax = 4.16; 71 voxels; data not shown). B, Group mean activation in the left dPM, right mSPL and left mSPL (beta estimates ± SEM) is plotted for congruent and incongruent trials as a function of conflict frequency context, illustrating the critical interactions in each region: all F(1,24) > 10.6; all p < .005. C, Regions identified by the behaviorally-informed context × congruency regression analysis are plotted (yellow) together with the results of the conventional interaction analysis (red) at p < .05 (corrected) on axial (z 64) and coronal (y -48) slices of an individual brain. The orange region represents the conjunction of the two effects. Brain-behavior relationships were also evident in the left mSPL at a slightly more lenient extent threshold (x -16, y -56, z 72; Tmax = 4.26; 153 voxels). D, Correlation between individual mean levels of BOLD activity (z-normalized beta estimates) in the right and left mSPL associated with contextual variation in conflict processing (calculated as the difference between in interference effects in the high-conflict vs. low-conflict contexts, i.e. interferencehigh-conflict context – interferencelow-conflict context) and the individual z-normalized behavioral context-specific interference effect scores (interferencelow-conflict context - interferencehigh-conflict context). Each point corresponds to the values from one participant.

