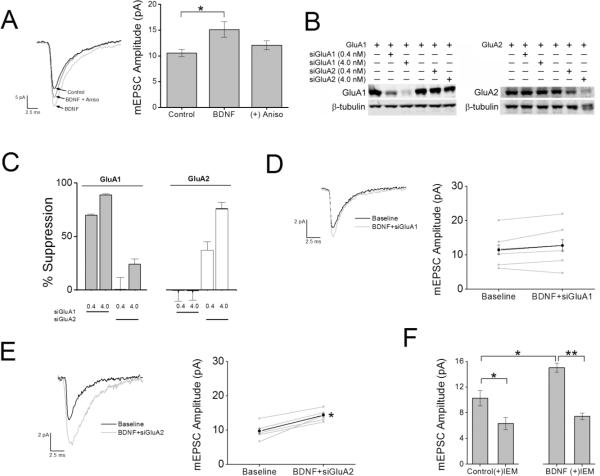
Figure 7.
BDNF-induced increase in synaptic strength requires protein synthesis of GluA1 subunits coupled to expression of CP-AMPARs. A, Left, example traces of mEPSCs recorded at room temp at a holding potential of −70 mV for each condition indicated. Traces were an average of 100 – 150 consecutive events recorded during each treatment condition. In the indicated experiments, neurons were pretreated with anisomycin for 30 min prior to the addition of BDNF to impair translation. Right, group data for mean mEPSC amplitude for control (n = 12), BDNF (n = 6); *p<0.05 by Student's t test) and BDNF in the presence of anisomycin (Aniso; n = 6). B, Representative western blot for GluA1 and GluA2 subunits expressed in HEK cells in the absence or presence of 0.4 or 4.0 nM siRNA for GluA1 or GluA2. β-tubulin was used as a loading control. C, Quantification of GluA1 and GluA2 knockdown for conditions indicated in panel B for 4 independent experiments. D and E, left panel shows average mEPSCs recorded during baseline and following treatment with BDNF with inclusion of siGluA1 (D) or siGluA2 (E) in the patch pipette. Individual (grey) and mean (black) mEPSC amplitudes are depicted in the right panel for siGluA1 (D; n = 7) and siGluA2 (E; n = 5). *p<0.05 by Student's paired t test. F. Group data illustrating the mean reduction in mEPSC amplitude as a percentage of baseline responses following IEM treatment under baseline conditions (left; n = 12) and following BDNF stimulation (right; n = 7). Error bars indicate SEM. *p < 0.05 by Student's paired t test.

