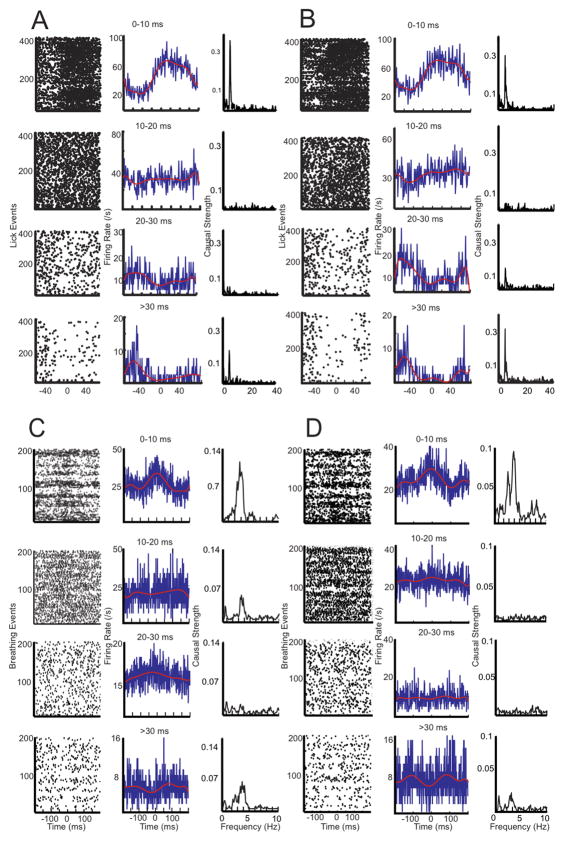
Figure 5. Granger causality analysis of biological and surrogate spike and lick data as a function of inter-spike interval duration.
A) Left column: Peri-event raster plots for spikes preceding intervals of durations as indicated at the center above each plot. Black dots represent spikes. Time ‘0’ on the X-axis corresponds to the time at which the mouse’s tongue touched the water sprout. Middle column: Firing rate estimation from the peri-event time histogram (PETH). The blue traces correspond to firing rate estimation per 1 ms bins. Red traces are an 8th order polynomial fit for spike rate modulation. Right column: Granger causality analysis for lick to spikes causality. The peak at 6 Hz corresponds to the average lick frequency and represents a causal relationship between licking behavior and simple spike activity. Note there is a high causal strength for short and long inter-spike interval durations compared to intermediate ones. B) The same analyses as in A) but performed on surrogate spike trains. Left column: Raster plots of surrogate spike activity. Middle column: Firing Rate estimation from PETH. Right column: Granger causality analysis for surrogate spike trains. C, D) Same analyses carried out for a representative PC recording in relation to breathing.

